Remotely Debug and Test JavaScript Using the New Vorlon.JS Plugins

In April 2015, our team of engineers and tech evangelists at Microsoft launched Vorlon.js — an open source, extensible, platform-agnostic tool for remotely debugging and testing your JavaScript.
When we launched the project during the Microsoft Build Developer Conference keynote, we had only three plugins: the DOM Explorer, the Interactive Console and Modernizr. We knew at this time that the key to the success for a project such as Vorlon is the quantity and quality of plugins. When you want to debug your website, you do not want to do much complicated things. You just want to pick the correct plugin and get the correct information.
This is why we made this project open source. We know you have a lot of ideas to provide great debug experiences to web developers.
So… 2 months, 66 pull requests, 78 issues and 547 commits later: we are proud to announce that we (YOU and the team) just released Vorlon.js version 0.0.15! You can get it by either cloning our GitHub repository or installing it using npmcommand tool (npm install –g vorlon).
Note: if you are still wondering what Vorlon.js is, please read this article from David Catuhe first.
Let’s have a look at what is new in this version.
New Plugins
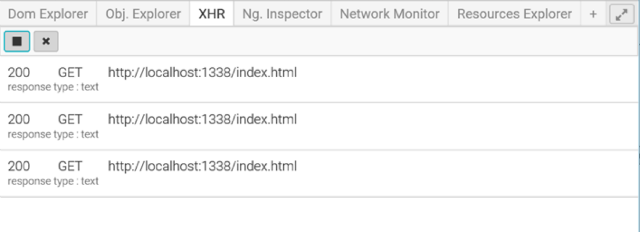
XHR Panel is here to help you get the list of requests done through XMLHttpRequest. You can choose to enable or disable the recording using the play button.
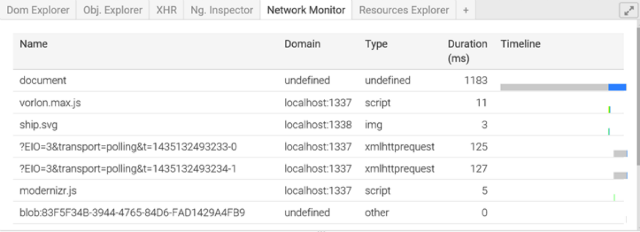
Network Monitor is bringing the ability for you in Vorlon to see all the network exchanges that are done between the browser and the web server. It provides the resource name, the server domain, the type of request, the duration in milliseconds and a nice visual timeline!
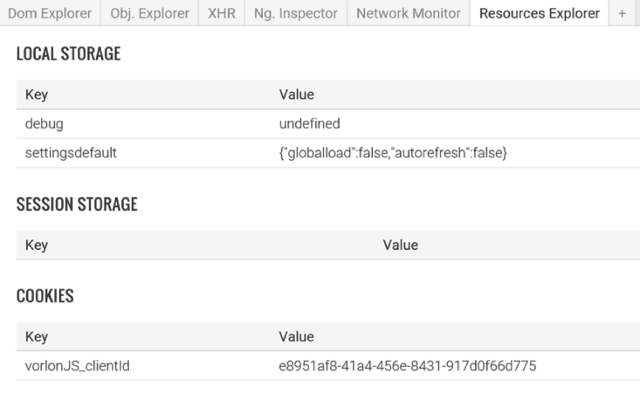
Resource Explorer gives you information about what is stored locally on the client browser instance. There is data aboutSessions, Cookies, and Local Storage. This can be really useful when you want to debug local cache or login / persistent user data issues.
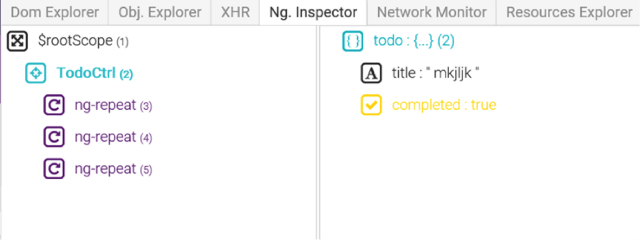
NG Inspector is a $scope debugger for Angular.js. You have an easy access to all the values stored in each scope. This first version gives you information, a future one will give you the ability to edit your scopes.
Plugin Improvements
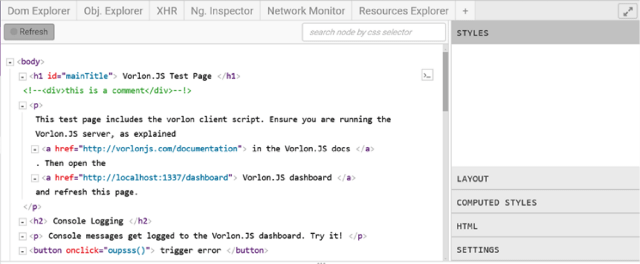
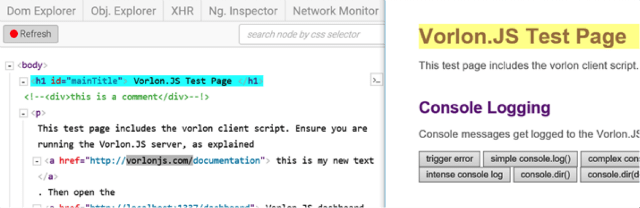
DOM Explorer has been improved a LOT.
Previously, this plugin was sending all the DOM data from the client to the dashboard each time it changed. This had a huge impact on performances. This is now fixed and you can refresh the DOM from the client either by asking it manually hitting the refresh button, or activating the auto-refresh on the Settings pane. The autofresh is smarter and uses MutationObserver if available on the client browser.
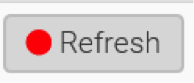
Bonus feature: when the DOM changes on the client side, the round indicator in the refresh button changes to red! ;-)
As you can see, the DOM Exploring pane is more beautiful and easier to read.
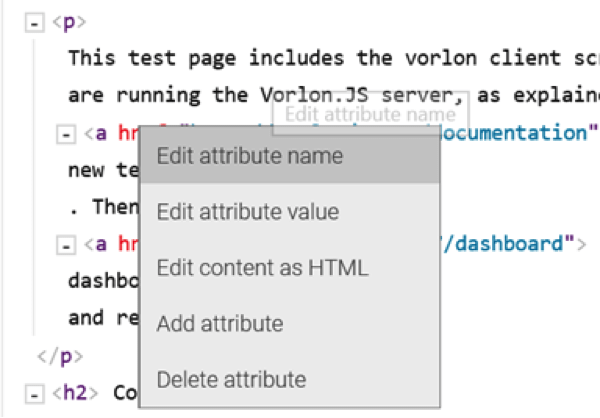
You can now edit HTML content and attributes by clicking on it. When hitting ENTER, the changes will be applied on the client side.
The DOM highlighting feature is easier to access. It happens when your mouse goes over the DOM element on the DOM explorer in the Vorlon dashboard.
You can also right click on an element to remove or edit things. This is the best ergonomic way to enable deletion on attributes.
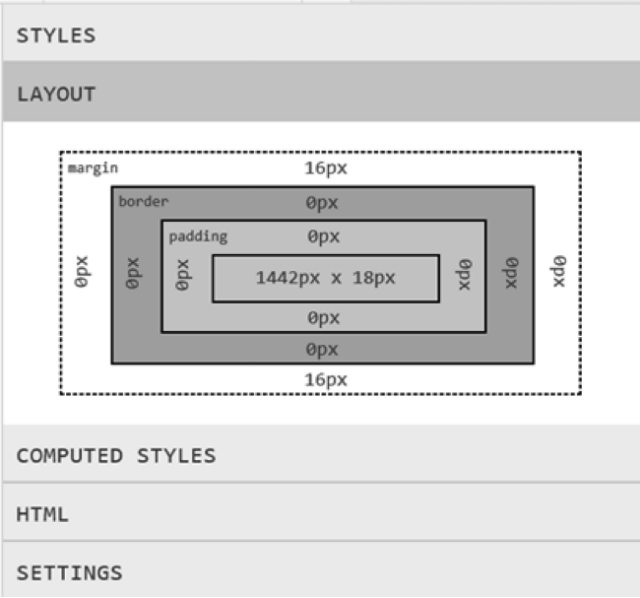
In the right pane, you have more information that just only the real CSS code now.
The layout tab gives you information that you are used to get in classic F12 tools: the margin, padding, border and size information.
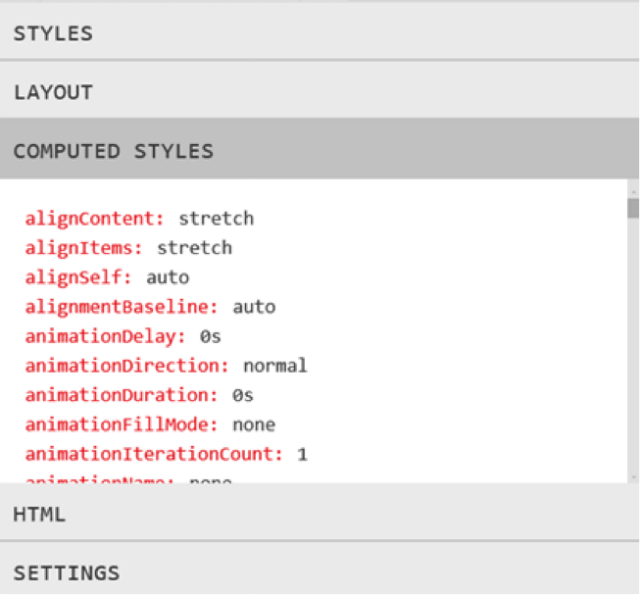
Same thing for the computed styles which contains all the CSS styles applied explicitly and implicitly inherited.
The HTML tab is a better tool to edit text in the DOM. You can do breaklines and apply the change by hitting the save button.
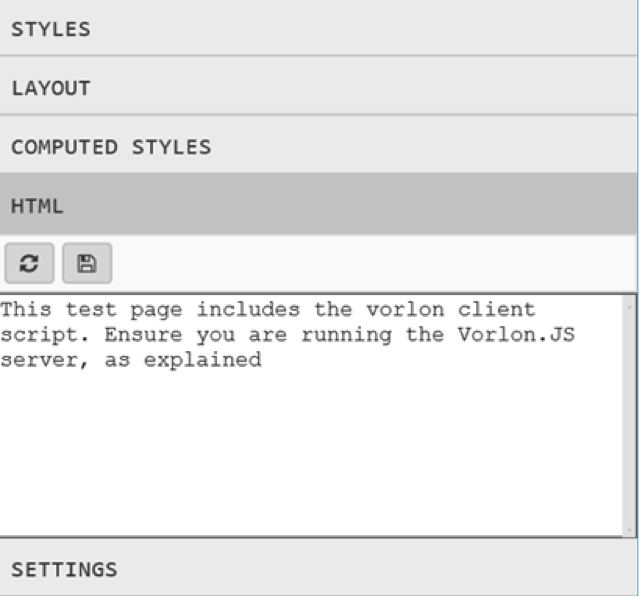
Finally, the settings section is where is you can activate the auto refresh for the DOM.
Interactive Console have some new features too.
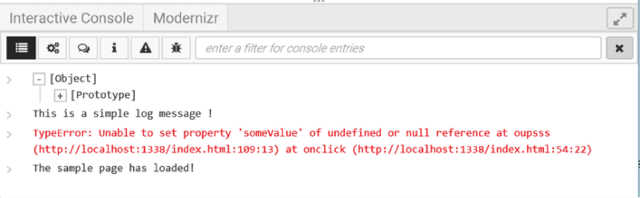
We have the windows.onerror, console.dir and complex object log support. You can navigate in object properties using a visual tree. Filters are available to only show a subset of logs and you can filter using a search-like text area.
Other Changes and Improvements
We did a lot of other changes in the code organization and structures that are not directly visible in plugins and features.
For instance, we renamed and moved the catalog.json file which contains the list of plugins and some parameters to the Server folder. It is now called config.json because some parameters are not related to plugins. To avoid copy paste and to simplify debug and usage, we also added an enabled boolean parameter in the plugins configuration in config.json. If false for a specific plugin it will not be loaded in the dashboard and not sent to the client in the generated vorlon.js file.
We also split the plugins in 2 separated files. Originally a plugin was composed of only one JavaScript file containing the code for the dashboard and the client side. It was easier when we started the project. Now that more complex plugins are created and for optimization reasons we split this into 2 different files: yourplugin.client.js and yourplugin.dashboard.js.
You can read more about the changes we made in the whatsnew.md file available on our GitHub repo.
What’s Next?
We are now working on the next version which will contain new plugins and core improvements. Authentication, webgl, webaudio are part of the list!
As I said, we want this project to be the web developer’s project. If you have an idea, you can either:
- Submit an issue on GitHub
- Create is yourself and submit a pull request (we review this every day!)
Note: to help you learn how to create plugins, I have written this: http://bit.ly/vorlonplugin
Let’s work together on Vorlon.js to make debug experiences easier and better.
Do not forget to follow our team's Twitter account!
More Hands-on with JavaScript
This article is part of the web development series from Microsoft tech evangelists on practical JavaScript learning, open source projects, and interoperability best practices including Microsoft Edge browser and the new EdgeHTML rendering engine.
We encourage you to test across browsers and devices including Microsoft Edge – the default browser for Windows 10 – with free tools on dev.modern.IE:
- Scan your site for out-of-date libraries, layout issues, and accessibility
- Use virtual machines for Mac, Linux, and Windows
- Remotely test for Microsoft Edge on your own device
- Coding Lab on GitHub: Cross-browser testing and best practices
In-depth tech learning on Microsoft Edge and the Web Platform from our engineers and evangelists:
- Microsoft Edge Web Summit 2015 (what to expect with the new browser, new supported web platform standards, and guest speakers from the JavaScript community)
- Woah, I can test Edge & IE on a Mac & Linux! (from Rey Bango)
- Advancing JavaScript without Breaking the Web (from Christian Heilmann)
- The Edge Rendering Engine that makes the Web just work (from Jacob Rossi)
- Unleash 3D rendering with WebGL (from David Catuhe including the vorlon.JS and babylonJS projects)
- Hosted web apps and web platform innovations (from Kevin Hill and Kiril Seksenov including the manifold.JS project)
More free cross-platform tools & resources for the Web Platform:
This article has been written by Etienne Margraff on behalf of all the Vorlon.js core team: David Catuhe, David Rousset, Pierre Lagarde and Justin Garrett. If you have any question about this article or Vorlon.js, feel free to contact Etienne on Twitter.