
Six Little-Known Facts to Help You Create Viral Infographics
It all sounds too simple: You collect your data, create a good-looking piece of infographic, embed it on your website and it drives traffic, boosts your sales or generates more leads. Yet there are many, many infographics that sitting undiscovered in some corner of the deep web.
 Image by PublicDomainPictures from Pixabay
It’s true – data never sleeps. This infographic by DOMO says it all. For example, there were 347 Wordpress blog posts created every minute on the web already two years ago. Google got over 2 Million queries per minute!
Image by PublicDomainPictures from Pixabay
It’s true – data never sleeps. This infographic by DOMO says it all. For example, there were 347 Wordpress blog posts created every minute on the web already two years ago. Google got over 2 Million queries per minute!
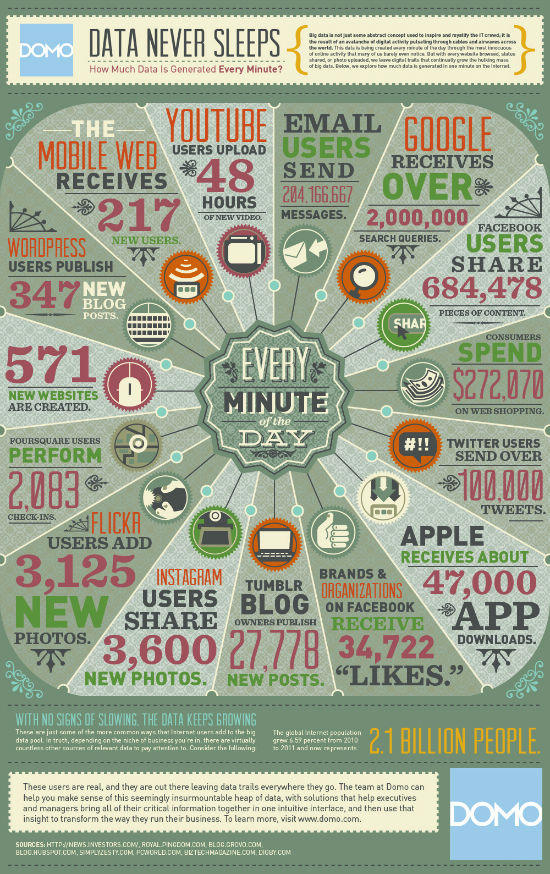 Click the image for a larger version over at DOMO
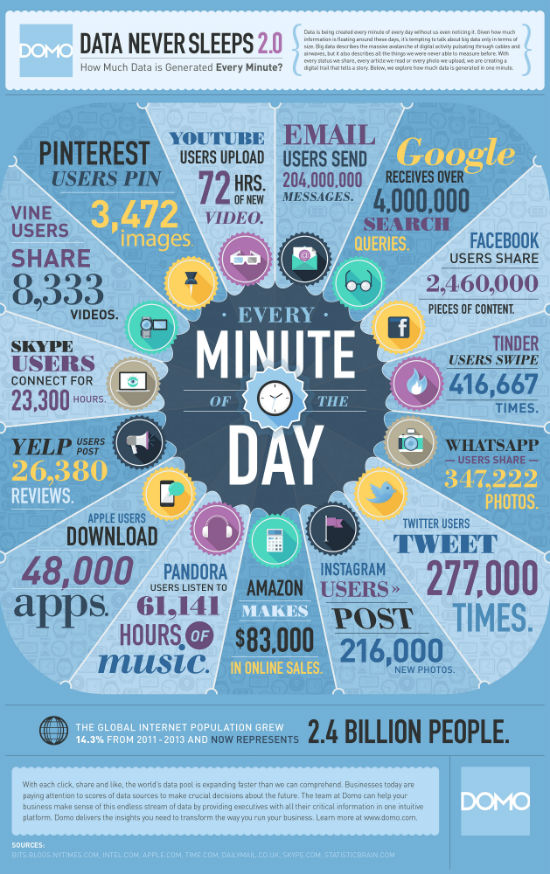
Look at the most recent infographic by DOMO, they updated the one before to version 2.0 with all the shiny new data. YouTube went up from 48 submitted hours per minute to 72 hours per minute. Unfortunately they didn't include WordPress post frequency here again. Google these days is hit by 4 million queries per minute, a 100 percent rise.
Click the image for a larger version over at DOMO
Look at the most recent infographic by DOMO, they updated the one before to version 2.0 with all the shiny new data. YouTube went up from 48 submitted hours per minute to 72 hours per minute. Unfortunately they didn't include WordPress post frequency here again. Google these days is hit by 4 million queries per minute, a 100 percent rise.
 Click the image for a larger version over at DOMO
My point? A lot of data means a lot of infographics are being created every minute. Do a simple search of the word “infographic” on Google and you’ll get about 13 Million results (of course this includes duplicates, but you get the point).
Big data makes it very necessary to police infographic data and to separate bad infographics from good ones. Not only that, it makes things even harder for a legitimate, trusty and useful infographic to go viral because there are so many of its brothers and sisters doing the rounds of the Net.
KissMetrics estimates that making a campaign viral could have an effect that’s 500-1000 times more than that of a non-viral campaign. One way to make use of virality is to have your infographic discovered by an authoritative site.
That said, let’s look at some ways to make your infographic go viral in 2014. The first two tips are mainly during pre-production and production, and the last three work during post-production:
Click the image for a larger version over at DOMO
My point? A lot of data means a lot of infographics are being created every minute. Do a simple search of the word “infographic” on Google and you’ll get about 13 Million results (of course this includes duplicates, but you get the point).
Big data makes it very necessary to police infographic data and to separate bad infographics from good ones. Not only that, it makes things even harder for a legitimate, trusty and useful infographic to go viral because there are so many of its brothers and sisters doing the rounds of the Net.
KissMetrics estimates that making a campaign viral could have an effect that’s 500-1000 times more than that of a non-viral campaign. One way to make use of virality is to have your infographic discovered by an authoritative site.
That said, let’s look at some ways to make your infographic go viral in 2014. The first two tips are mainly during pre-production and production, and the last three work during post-production:
 Show your face, don't be neutral
To influence masses and create a wave, don’t feel afraid to experiment and go fully vocal about your stand (which pre-supposes take a stand!). The aim is to get people to love you or hate you but never ignore you.
Show your face, don't be neutral
To influence masses and create a wave, don’t feel afraid to experiment and go fully vocal about your stand (which pre-supposes take a stand!). The aim is to get people to love you or hate you but never ignore you.
 Image by David Mark from Pixabay
Use simple, short and keyword-rich headlines. A good headline will have at least one powerful word that captures their emotion (words such as “shocking”, “trust”, “warning”, “lies”, “mistakes” etc).
A cool resource I’ve been using to hack headlines is Jon Morrow’s 52 Headline Hacks. It’s mainly created for viral blog posts but you can well use it for infographics also.
Image by David Mark from Pixabay
Use simple, short and keyword-rich headlines. A good headline will have at least one powerful word that captures their emotion (words such as “shocking”, “trust”, “warning”, “lies”, “mistakes” etc).
A cool resource I’ve been using to hack headlines is Jon Morrow’s 52 Headline Hacks. It’s mainly created for viral blog posts but you can well use it for infographics also.
 There are many infographic-specific directories that will happily publish your work. Try the following ones:
1. Visual.ly (Free)
2. Daily Infographic (Paid)
3. Submit Infographics (Free)
4. Infographick (Free)
5. Cool Infographics (Free)
6. Flickr (Free)
7. Pinterest (Free)
8. Visual Loop (Free)
A resource of all directories is listed here.
There are many infographic-specific directories that will happily publish your work. Try the following ones:
1. Visual.ly (Free)
2. Daily Infographic (Paid)
3. Submit Infographics (Free)
4. Infographick (Free)
5. Cool Infographics (Free)
6. Flickr (Free)
7. Pinterest (Free)
8. Visual Loop (Free)
A resource of all directories is listed here.
 Image by Gerd Altmann from Pixabay
Another cool way to find more leads is by doing a quick search on Twitter for your keyword. If you see these people have a good following and have their niche in common with you, go ahead and talk to them. Do the same for big Facebook pages.
Make a list of all Facebook, Twitter and blog contacts that are talking on your topic and reach out to them one by one, via email. The longer this list, the better. Create an excel sheet for this and add columns for their social media contacts, direct email and website.
Don’t forget to make a reference to a relevant post on their website – you’ll have to make a mention of this post when you’re reaching out to them. This not only shows you’ve got things in common but also that you’ve done your homework.
Image by Gerd Altmann from Pixabay
Another cool way to find more leads is by doing a quick search on Twitter for your keyword. If you see these people have a good following and have their niche in common with you, go ahead and talk to them. Do the same for big Facebook pages.
Make a list of all Facebook, Twitter and blog contacts that are talking on your topic and reach out to them one by one, via email. The longer this list, the better. Create an excel sheet for this and add columns for their social media contacts, direct email and website.
Don’t forget to make a reference to a relevant post on their website – you’ll have to make a mention of this post when you’re reaching out to them. This not only shows you’ve got things in common but also that you’ve done your homework.
 Image by (El Caminante) from Pixabay
A lot of times, people will publish your work but forget to link back. In times such as this, it’s pretty smart to include a water mark on your infographic. Picmarkr is a free watermark service you can try.
If you included a watermark, it’s still a good idea to have people link back to your site. Search for the title of your infographic in Google. You’ll find a list of websites that are using your infographic. Better yet, go to www.images.google.com and make a direct image search by uploading your infographic.
Image by (El Caminante) from Pixabay
A lot of times, people will publish your work but forget to link back. In times such as this, it’s pretty smart to include a water mark on your infographic. Picmarkr is a free watermark service you can try.
If you included a watermark, it’s still a good idea to have people link back to your site. Search for the title of your infographic in Google. You’ll find a list of websites that are using your infographic. Better yet, go to www.images.google.com and make a direct image search by uploading your infographic.
Image by PublicDomainPictures from Pixabay
It’s true – data never sleeps. This infographic by DOMO says it all. For example, there were 347 Wordpress blog posts created every minute on the web already two years ago. Google got over 2 Million queries per minute!
Click the image for a larger version over at DOMO
Look at the most recent infographic by DOMO, they updated the one before to version 2.0 with all the shiny new data. YouTube went up from 48 submitted hours per minute to 72 hours per minute. Unfortunately they didn't include WordPress post frequency here again. Google these days is hit by 4 million queries per minute, a 100 percent rise.
Click the image for a larger version over at DOMO
My point? A lot of data means a lot of infographics are being created every minute. Do a simple search of the word “infographic” on Google and you’ll get about 13 Million results (of course this includes duplicates, but you get the point).
Big data makes it very necessary to police infographic data and to separate bad infographics from good ones. Not only that, it makes things even harder for a legitimate, trusty and useful infographic to go viral because there are so many of its brothers and sisters doing the rounds of the Net.
KissMetrics estimates that making a campaign viral could have an effect that’s 500-1000 times more than that of a non-viral campaign. One way to make use of virality is to have your infographic discovered by an authoritative site.
That said, let’s look at some ways to make your infographic go viral in 2014. The first two tips are mainly during pre-production and production, and the last three work during post-production:
1. Be Anything but Neutral
If you want to move crowds, create traction and see your infographic go viral, make it “viral-worthy” first. Are you playing too safe and neutral? People will subconsciously create a label for you: Boring. And guess what? There are too many boring things out there online so you don’t have to be one of them.2. Use Stellar Headlines
Image by David Mark from Pixabay
Use simple, short and keyword-rich headlines. A good headline will have at least one powerful word that captures their emotion (words such as “shocking”, “trust”, “warning”, “lies”, “mistakes” etc).
A cool resource I’ve been using to hack headlines is Jon Morrow’s 52 Headline Hacks. It’s mainly created for viral blog posts but you can well use it for infographics also.
3. Submit to Directories
There are many infographic-specific directories that will happily publish your work. Try the following ones:
1. Visual.ly (Free)
2. Daily Infographic (Paid)
3. Submit Infographics (Free)
4. Infographick (Free)
5. Cool Infographics (Free)
6. Flickr (Free)
7. Pinterest (Free)
8. Visual Loop (Free)
A resource of all directories is listed here.
4. Reach Out to Other Publishers
Now is the time to pull out your contact list and reach out to every blogger and publisher you know. Affiliates, websites you’ve networked with, experts in your niche...every one counts. It never hurts to ask – whether they accept your post or not is up to them. Although your aim is to target sites with huge traffic, don’t underestimate sites with moderate traffic. You never know who’s listening!
Image by Gerd Altmann from Pixabay
Another cool way to find more leads is by doing a quick search on Twitter for your keyword. If you see these people have a good following and have their niche in common with you, go ahead and talk to them. Do the same for big Facebook pages.
Make a list of all Facebook, Twitter and blog contacts that are talking on your topic and reach out to them one by one, via email. The longer this list, the better. Create an excel sheet for this and add columns for their social media contacts, direct email and website.
Don’t forget to make a reference to a relevant post on their website – you’ll have to make a mention of this post when you’re reaching out to them. This not only shows you’ve got things in common but also that you’ve done your homework.
5. Find People Who Forgot to Quote You
Image by (El Caminante) from Pixabay
A lot of times, people will publish your work but forget to link back. In times such as this, it’s pretty smart to include a water mark on your infographic. Picmarkr is a free watermark service you can try.
If you included a watermark, it’s still a good idea to have people link back to your site. Search for the title of your infographic in Google. You’ll find a list of websites that are using your infographic. Better yet, go to www.images.google.com and make a direct image search by uploading your infographic.
While making infographics, trying to make a good looking one I get to compromise on good information, and vice versa :(