40+ Free Online Tools and Software to Improve Your Workflow
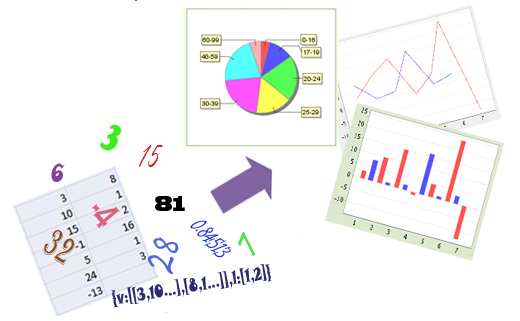
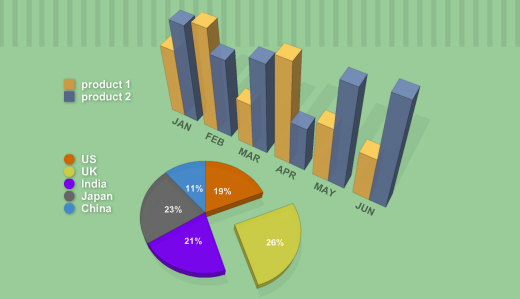
Charts and graphs are the most effective ways to show the relationship between two different and interlinked entities. On a web page, a comprehensively designed flowchart, diagram or graph can be worth a thousand words. Creating such charts that inform your visitors about all the necessary details is a daunting task, and many designers find creating charts, diagram and graphs a difficult job to accomplish.
Here, you will discover some of the best available free web services that let you create copious amounts of charts, diagrams and graphs. A majority of these services are easy to use; and will produce results that will be comparable to what you saw on the screen.
You can also use Filehorse to find the latest free online software.
Enjoy!
The Showcase
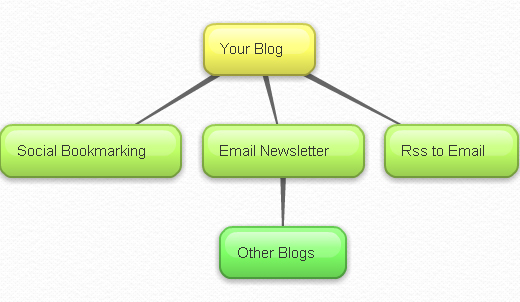
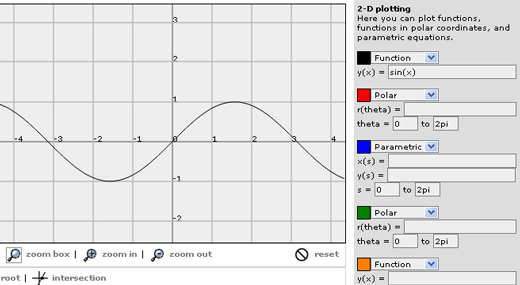
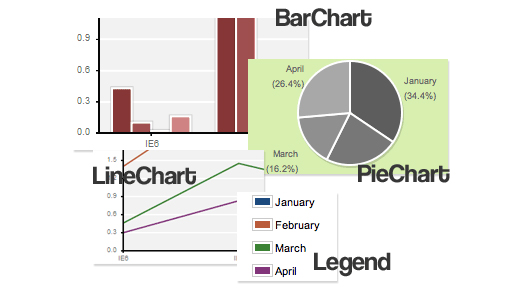
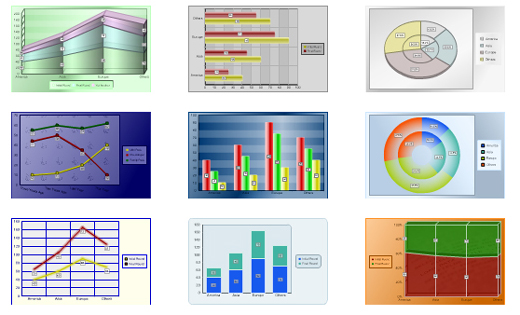
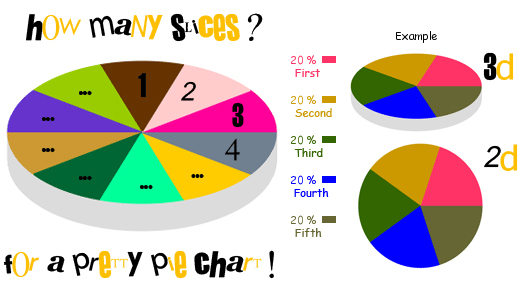
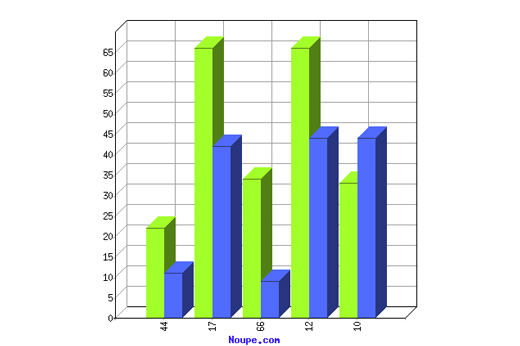
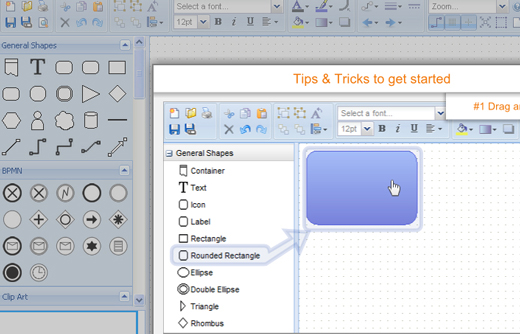
ChartDemo If you need to create a stacked area chart along with complete labels and legends, then ChartDemo is for you.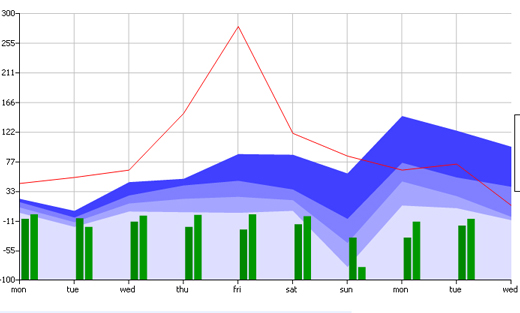

Creative collection. I have forwarded this to our developers for implementing this in our back office report.Thanks for sharing wonderful stuff
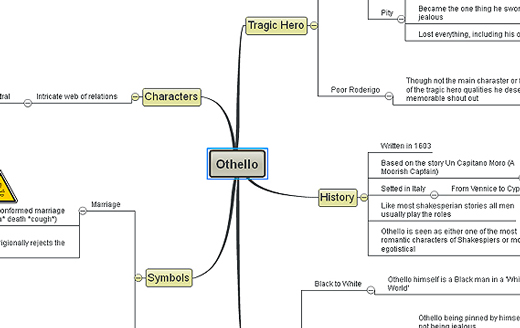
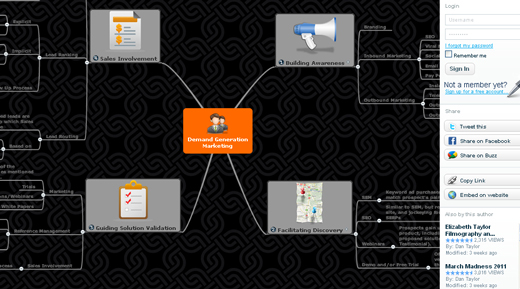
If you are looking for a free desktop Mind mapping software, check FreeMind. Works very well on all platforms.
nice article
XMind also works well and is free. I use it all the time. http://www.xmind.net/
I am officially impressed. I see some tools listed here I can recommend to my solo and startup clients to help them get a handle on systems creation for workflow.
Great Collection, bookmarked it for future. Keep it upcoming
Extremely useful resources, was looking something like this, thanks for sharing.
Awesome info as usual
nice collection,
Thank you for this useful collection!
Another addition to your list is dhtmlxChart, a JavaScript charting library that allows you to implement dynamic charts on a website or web app: http://dhtmlx.com/docs/products/dhtmlxChart/
Thanx…. awesome info…!!
Great collection, will use some of these!
Wow, thanks everyone for the amazing additions to the post, and for the enthusiasm for the resources Nousheen gathered.
Noupe Editorial Team
Some handy looking resources here!
Thank you for this collection! I frequently use visualization software for charts and graphs building. I can also add http://my.origramy.com/index.html to the list. It is free and usable to build diagrams and graphs.
very nice web site design & good articles also.I saw lot of IMP articles on this web site.
Keep it up.
Nice, this is very useful, thanks for sharing !
Great! These were really helpful to me. But is there an available Alexa toolbar for chrome? Thanks
Nice collection, thank you.
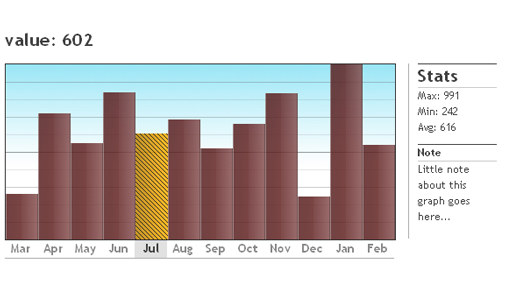
SWF Charts is really amazing – saved a lot of time for me.
If you looking for online flowcharting solution also try http://grapholite.com
This would really be helpful in tracking income matters specially in the business that I’m planning to do
Hi Nousheen!!
What about also taking a look at Jolicharts.com? It’s a really great online tool to create interactive charts and dashboard from your files (Excel, CSV) or even database.
You can create multiple dashboards even with a “Forever Free” account, share your work with other people on the same dashboard, publish it :
– Connect your data or spreadsheets,
– Design Charts & Dashboards with collaboration possibilities
– Share, Publish charts or dashboard, in one click.
– Embed the dashboards in all our apps, website.
– Apply information filters depending on the viewer.
Do not hesitate to go and see by yourself!
https://jolicharts.com/
Regards,