Beautifully Made Process Diagrams
Process Charting (also known as Process Mapping) is one of the oldest, simplest and most valuable techniques for streamlining work. It is used in nearly every level of production.
At the base of each product lays a properly designed production process that includes plenty of stages which help to channel efforts in the right direction and don`t get side-tracked from the main goal. So no matter what kind of service or product you provide, you more than likely will have some kind of process diagram you are working off of.
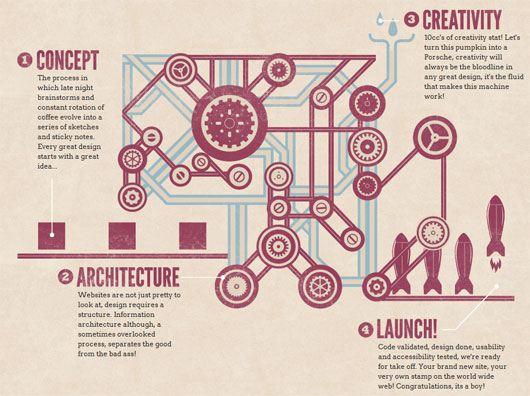 2. Web Agency Pisa
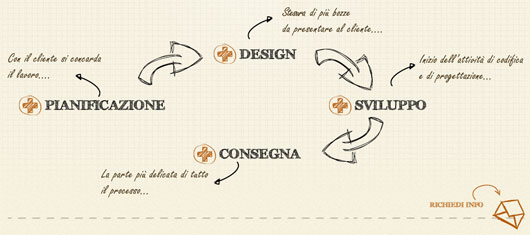 3. 3 Sided Coin
 4. Mark Jenner - Front-End Designer
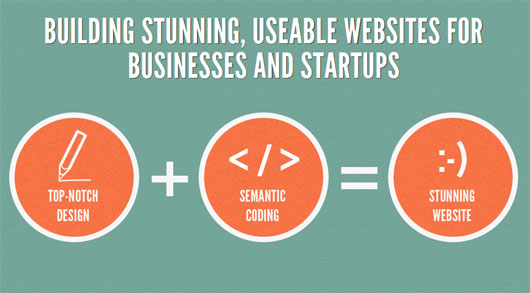 5. Mihael Miklosic - Web Designer
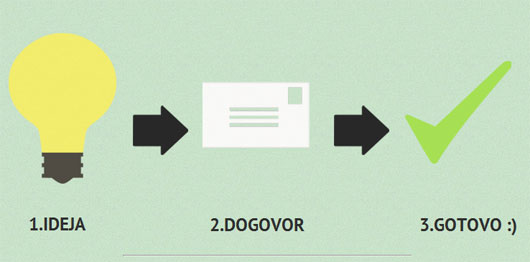 6. Alan Horne - Web/UI Designer and Front-End Developer
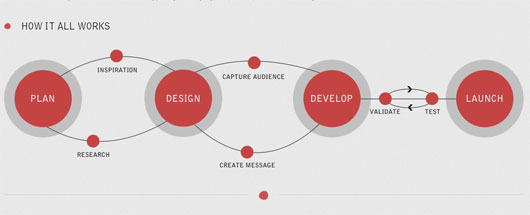 7. Paper Street Interactive
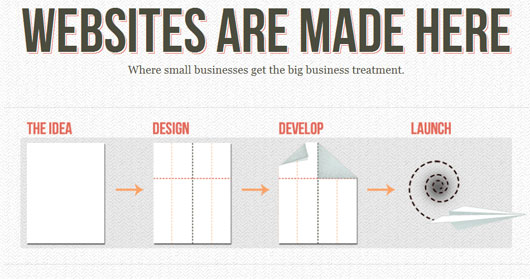 8. Jean-Philippe Gams - French Designer and Developer
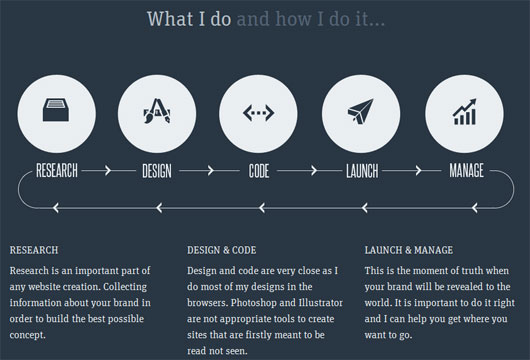 9. Ketch Studio
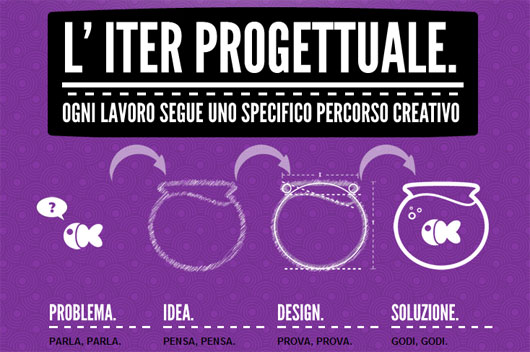 10. Camstech - Digital Agency Dubai
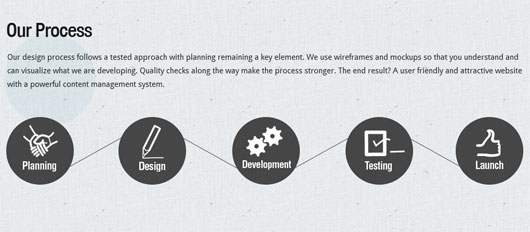 11. Webzeit
 12. Danny Giebe - Designer and Front-End Developer
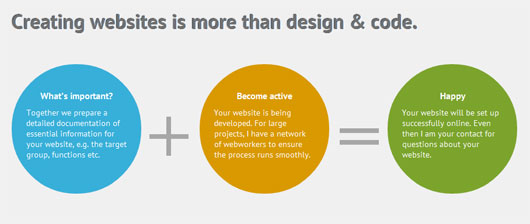 13. Jordesign - Designer
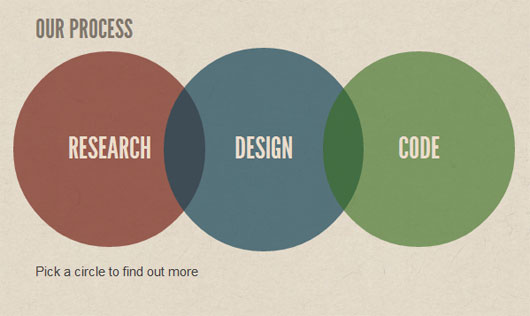 14. World of eStore
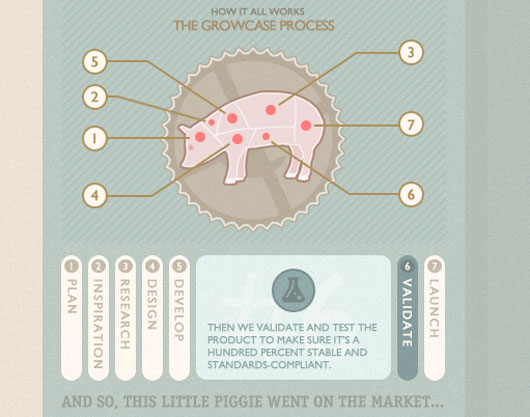
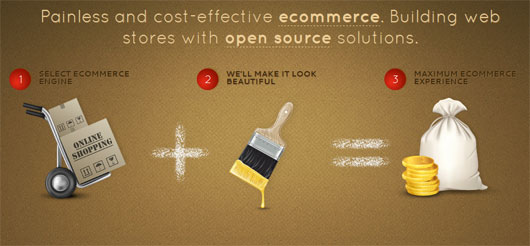 15. Growcase
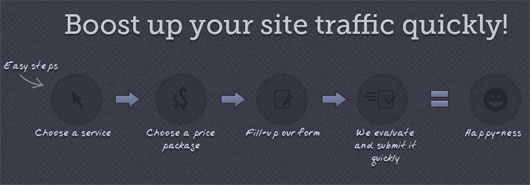
 16. Submit Quickly
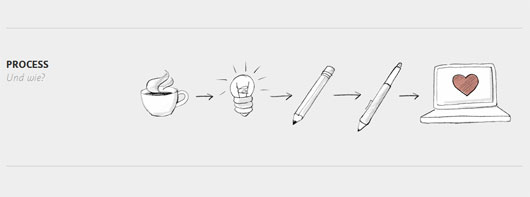
 17. Nadine Roba - Designer
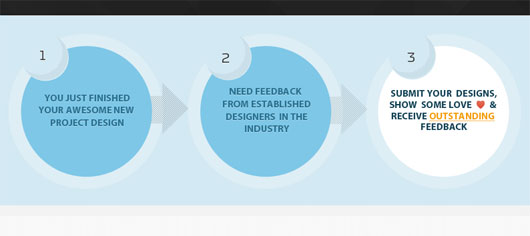
 18. U Feed Me Back
 19. Sebastianjt - Web Developer and UI Designer
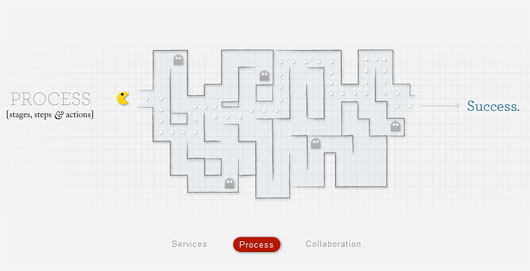 20. Tarful
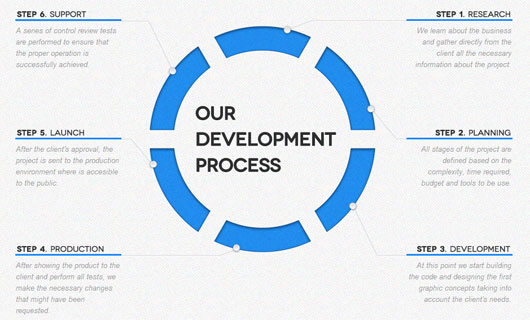 21. Tugrul Altun - Designer and Developer
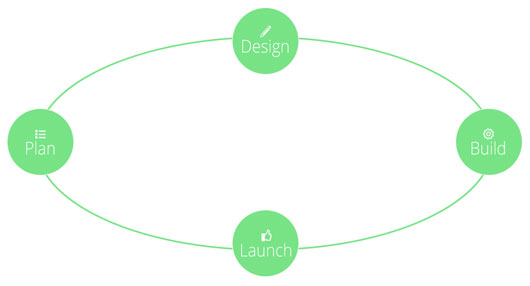 22. Raffaele Leone - Italian Web Designer
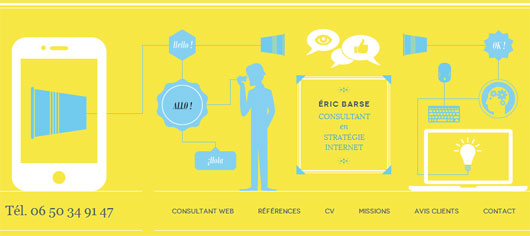
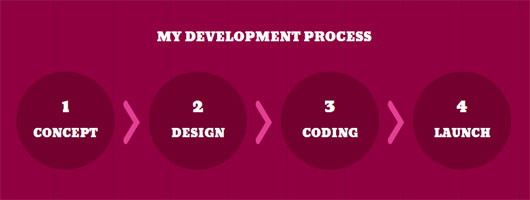 23. Eric Barse - Web Consultant
 24. Sandra Wilcox - Graphic Designer
 25. KenGraphX
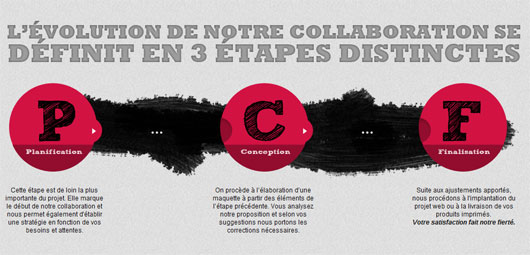 26. John Jacob - Designer and Developer
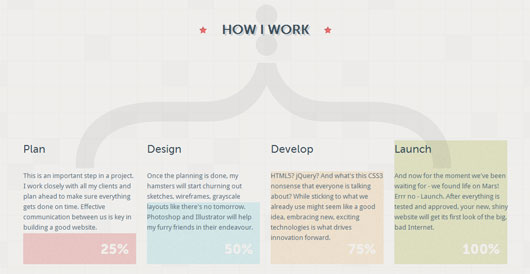 27. Rodolphe Celestin - French Web Designer
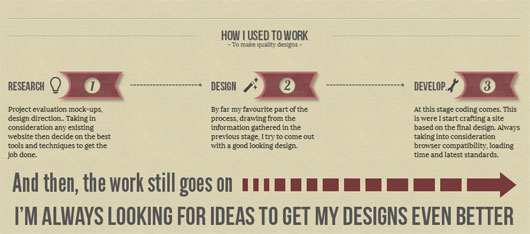 28. Reverend Danger
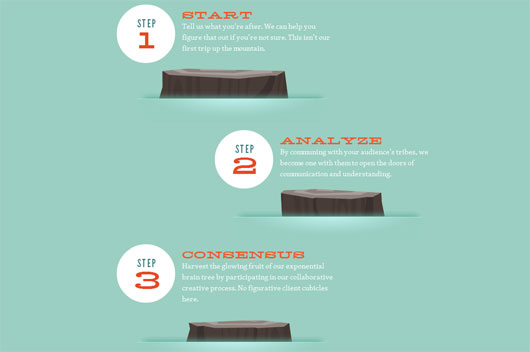 29. Jan Ploch - Web and Graphic Designer
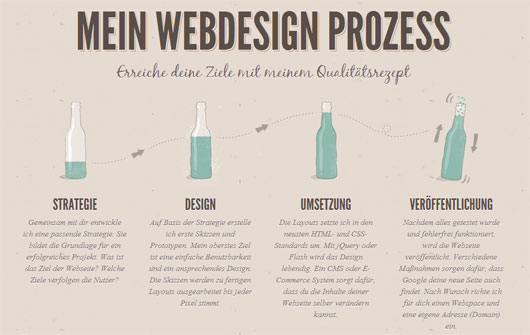 30. Janko at Warp Speed
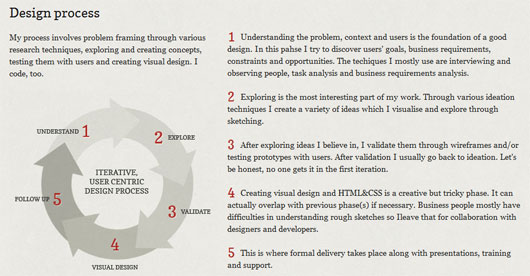 31. Ryan Coughlin - Web Designer and Developer
 32. Sendoushi
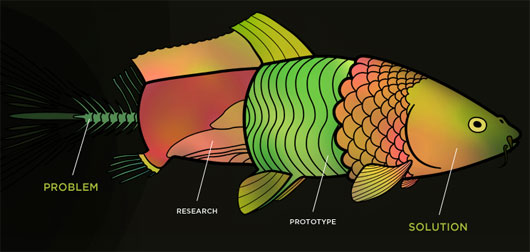 33. FortySeven Media
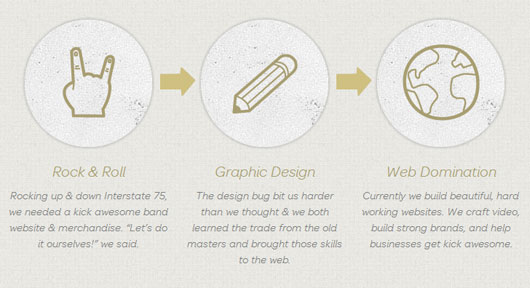 34. Work by Simon
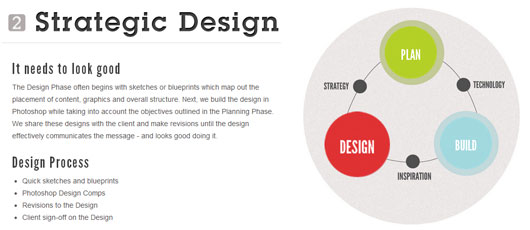 35. Rise Strategy
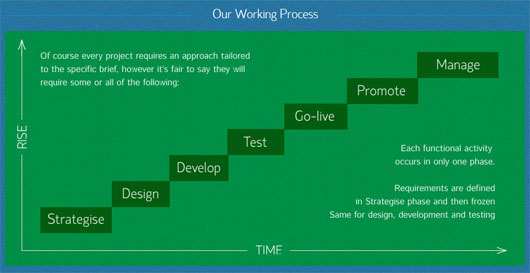 36. Pointless Corp
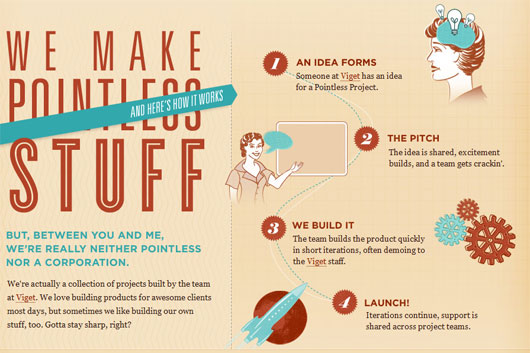 37. Tympanus
 (rb)
(rb)
Breakdown of the Breakdown
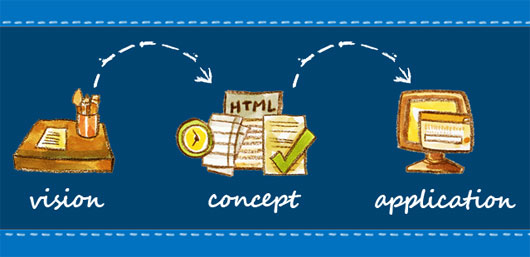
Since every process consists of actual tasks that must be completed the diagram usually gets divided into the main steps. For example, basic steps for companies and freelancers that create websites are:- Concept/Idea;
- Design;
- Develop;
- Test;
- Launch.
Sites That Get It Right
1. Deda - Web and Graphic Designer 2. Web Agency Pisa
 3. 3 Sided Coin
 4. Mark Jenner - Front-End Designer
 5. Mihael Miklosic - Web Designer
 6. Alan Horne - Web/UI Designer and Front-End Developer
 7. Paper Street Interactive
 8. Jean-Philippe Gams - French Designer and Developer
 9. Ketch Studio
 10. Camstech - Digital Agency Dubai
 11. Webzeit
 12. Danny Giebe - Designer and Front-End Developer
 13. Jordesign - Designer
 14. World of eStore
 15. Growcase
 16. Submit Quickly
 17. Nadine Roba - Designer
 18. U Feed Me Back
 19. Sebastianjt - Web Developer and UI Designer
 20. Tarful
 21. Tugrul Altun - Designer and Developer
 22. Raffaele Leone - Italian Web Designer
 23. Eric Barse - Web Consultant
 24. Sandra Wilcox - Graphic Designer
 25. KenGraphX
 26. John Jacob - Designer and Developer
 27. Rodolphe Celestin - French Web Designer
 28. Reverend Danger
 29. Jan Ploch - Web and Graphic Designer
 30. Janko at Warp Speed
 31. Ryan Coughlin - Web Designer and Developer
 32. Sendoushi
 33. FortySeven Media
 34. Work by Simon
 35. Rise Strategy
 36. Pointless Corp
 37. Tympanus
 (rb)
(rb) 
ThanX for the post!
I like the approach from Jean-Philippe Gams.
The collection is awesome.
Thanks for mentioned my website. It ‘can be added as a title Michele D’Orazio – Web Agency Pisa.
TK!!!
I like the idea to share Process Charting example for inspiration. Thanks for this nice collection.
Some really really nice examples in this article.
Thanks for sharing, and thanks for listing my website in the article!
-Simon
thanks for sharing, they are inspiring, and congratulations for the creators
How colourful and vibrant has this page been converted into by these gorgeous designs. Very inspirational. Great share once again.
I can really relate to Alan Horne’s process diagram..
Thanks for including us in the list!
Wow, some of the process diagrams are really great. People from the Business Process Management (BPM) community can also benefit from these examples.
Thanks for sharing the examples!
Awesome list – how many sites did you go through to put it together?? :) Love it!
I think these are the most visual charts:
#3
#7 (my favorite)
#9
#29
#37
Very nice images