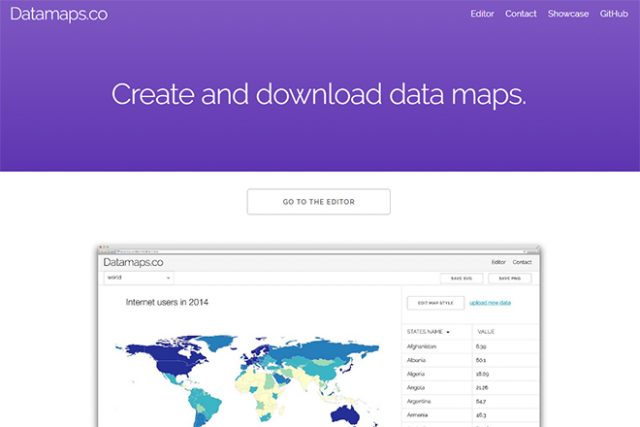
Datamaps.co: Quickly Create Maps as PNG or SVG
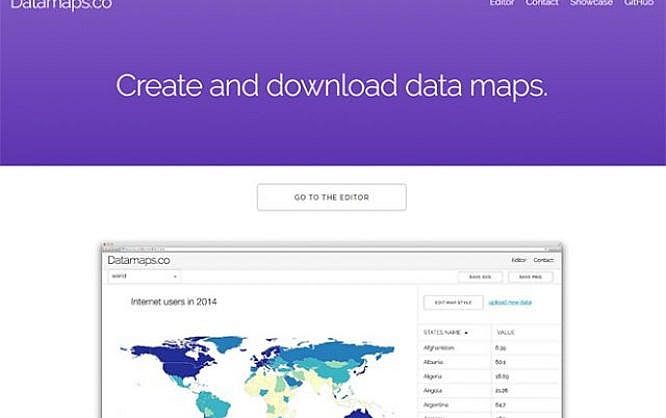
Maps are commonly used to visualize statistical data. Yet, these maps are not always available. Above all else, however, the editing of such datamaps always requires effort. The service Datamaps.co not only provides vector-based maps, but also makes it easy for you to add statistical data as well as adjust the design.
 Map Choice[/caption]
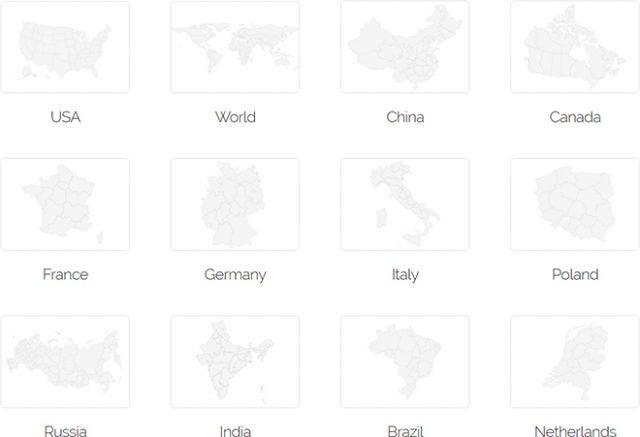
In total, there are 13 maps in addition to the world map that can be found at Datamaps.co. These are maps of the USA, Germany, China, Canada, France, Italy, Poland, Russia, India, Brazil, the Netherlands, Austria, and Switzerland.
Map Choice[/caption]
In total, there are 13 maps in addition to the world map that can be found at Datamaps.co. These are maps of the USA, Germany, China, Canada, France, Italy, Poland, Russia, India, Brazil, the Netherlands, Austria, and Switzerland.
 Entering Data Manually or Via CSV File[/caption]
The service creates a color scale between the highest and lowest value entered in the table, and colors each state according to its value. You'll receive a map that tells you about the statistical distribution of your data by different colors (should you have used the numbering that way).
Entering Data Manually or Via CSV File[/caption]
The service creates a color scale between the highest and lowest value entered in the table, and colors each state according to its value. You'll receive a map that tells you about the statistical distribution of your data by different colors (should you have used the numbering that way).
 Custom Coloration is Possible[/caption]
When it comes to the color scale, you get to choose between a linear scale that displays the transition between two colors, and an equidistant scale that is divided into equal sections. Here, a color is assigned to each section.
The latter scale is especially interesting when you want to divide the countries or subdivisions into statistical groups. This way, each group gets its own color. Here, you choose the amount of groups - between three and seven -, as well as the color scheme.
[caption id="attachment_77329" align="alignnone" width="640"]
Custom Coloration is Possible[/caption]
When it comes to the color scale, you get to choose between a linear scale that displays the transition between two colors, and an equidistant scale that is divided into equal sections. Here, a color is assigned to each section.
The latter scale is especially interesting when you want to divide the countries or subdivisions into statistical groups. This way, each group gets its own color. Here, you choose the amount of groups - between three and seven -, as well as the color scheme.
[caption id="attachment_77329" align="alignnone" width="640"]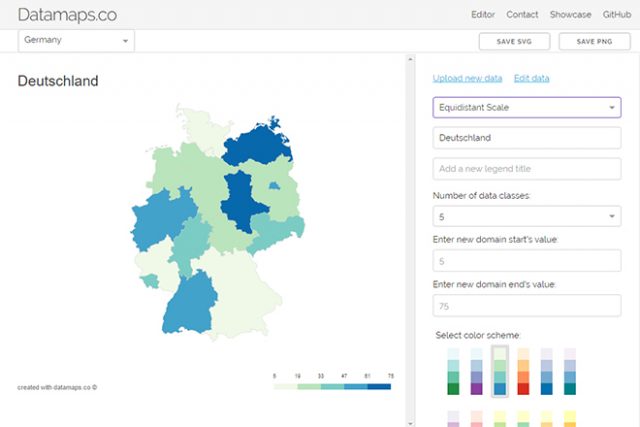 Map With an Equidistant Scale[/caption]
Choosing a Map
First, choose a map from Datamaps.co. Aside from a world map, there are maps of certain countries available as well. While only nation borders are marked on the world map, the maps of individual countries reflect political divisions. That means, that you'll find all states on the USA map, and all regions on the French map. [caption id="attachment_77327" align="alignnone" width="640"] Map Choice[/caption]
In total, there are 13 maps in addition to the world map that can be found at Datamaps.co. These are maps of the USA, Germany, China, Canada, France, Italy, Poland, Russia, India, Brazil, the Netherlands, Austria, and Switzerland.
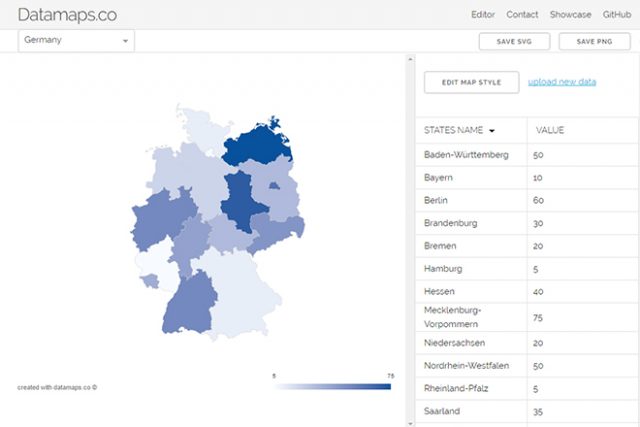
Lodging Data
Once you've chosen a map, set a numeric value for each nation or region. That means, that you'll have a list of all states for the USA map. You can enter a numerical value for each state. Subsequently, Datamaps.co will color all the states on the map differently. [caption id="attachment_77331" align="alignnone" width="640"] Entering Data Manually or Via CSV File[/caption]
The service creates a color scale between the highest and lowest value entered in the table, and colors each state according to its value. You'll receive a map that tells you about the statistical distribution of your data by different colors (should you have used the numbering that way).
Uploading Files Via CSV File
Entering values for close to 200 nations takes a lot of effort. However, you could also upload a CSV file that contains the information. For that, the first column of the table always needs to contain the three-letter ISO-3166-1-label (ALPHA-3) of the country. The names for the federal subdivision varies between countires. For German maps, for example, the ISO 3166-2-label (NW for North Rhine-Westphalia, for instance) is used. However, there's also the option to download an example table for each map, which already contains all column labels. Then, all you need to do is place the numbers in the second column and upload the map.Adjusting Looks and Labelling of the Maps
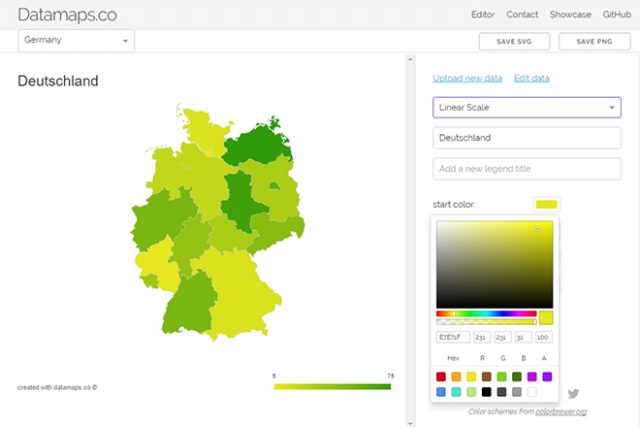
To round it all up you adjust the design of the map and add a title as well as a caption. The caption is used to explain the color scale and the way to read it. It will also reflect the lowest and highest value. [caption id="attachment_77330" align="alignnone" width="640"] Custom Coloration is Possible[/caption]
When it comes to the color scale, you get to choose between a linear scale that displays the transition between two colors, and an equidistant scale that is divided into equal sections. Here, a color is assigned to each section.
The latter scale is especially interesting when you want to divide the countries or subdivisions into statistical groups. This way, each group gets its own color. Here, you choose the amount of groups - between three and seven -, as well as the color scheme.
[caption id="attachment_77329" align="alignnone" width="640"] Map With an Equidistant Scale[/caption]
Great Post i follow all steps its awesome…