
Enhance your JavaScript Debugging Life with Cross-browser Source Maps
As a JavaScript developer, I’m sure you’ve already been falling into this scenario: something goes wrong with the production version of your code, and debugging it directly from the production server is a nightmare simply because it has been minified or has been compiled from another language such as TypeScript or CoffeeScript.
The good news? The latest versions of browsers can help you solve this problem by using source map. In this tutorial, I’ll show you how to find Source Maps in all of the browsers and get the most out of those few minutes you have to debug.
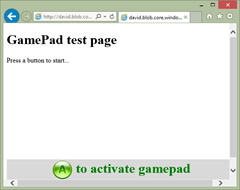 Plug an Xbox 360 or Xbox One controller in the USB port of your machine. Press the A button to activate the gamepad and play with it:
 But don’t worry, you won’t need a gamepad controller to follow this tutorial.
Note: The TypeScript compiler is automatically generating the source map for you. If you’d like to generate a source map while generating your minified version of your code, I would recommend using Uglify JS 2: https://github.com/mishoo/UglifyJS2
For this article, I even mixed both. I’ve minified the JS generated by TypeScript and kept the source mapping intact using this command line:
uglifyjs testgamepad.js -o testgamepad.min.js --source-map testgamepad.min.js.map --in-source-map testgamepad.js.map
But don’t worry, you won’t need a gamepad controller to follow this tutorial.
Note: The TypeScript compiler is automatically generating the source map for you. If you’d like to generate a source map while generating your minified version of your code, I would recommend using Uglify JS 2: https://github.com/mishoo/UglifyJS2
For this article, I even mixed both. I’ve minified the JS generated by TypeScript and kept the source mapping intact using this command line:
uglifyjs testgamepad.js -o testgamepad.min.js --source-map testgamepad.min.js.map --in-source-map testgamepad.js.map
 Let’s start by reviewing the “babylon.gamepads.ts” case. Why does IE show it instead of the .js version being executed by the browser?
This is thanks to the source map mechanism. At the end of the “babylon.gamepads.js” file, you can find this specific line:
Let’s start by reviewing the “babylon.gamepads.ts” case. Why does IE show it instead of the .js version being executed by the browser?
This is thanks to the source map mechanism. At the end of the “babylon.gamepads.js” file, you can find this specific line:
 You can debug it as you’re used to debug your JS code. Even if it’s the compiled JavaScript version currently being executed by the browser.
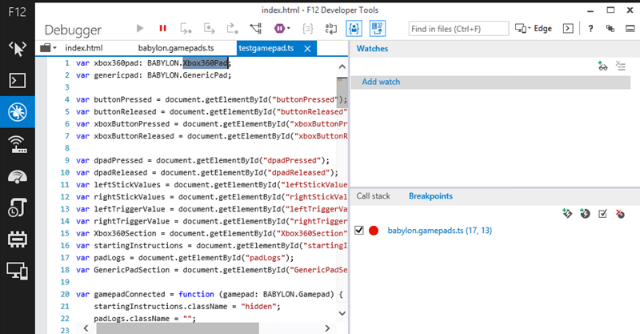
Set a breakpoint on the line 17 and press F5 in the browser window. You’ll be able to debug the TypeScript version of the constructor:
You can debug it as you’re used to debug your JS code. Even if it’s the compiled JavaScript version currently being executed by the browser.
Set a breakpoint on the line 17 and press F5 in the browser window. You’ll be able to debug the TypeScript version of the constructor:
 Step up to line 20, mouse over “this” and expand it to check that “gamepadEventSupported” is set to true:
 Click on the configuration icon and make sure that the “Enable JavaScript source maps” option is enabled. It should be set by default:
 Chrome/Opera let you reviewing the executed “babylon.gamepads.js” code but if you tries to set a breakpoint in the JavaScript version, it won’t display it. It will set it instead in the source code mapped to this version: “babylon.gamepads.ts”.
For instance, try to set a breakpoint on the line 18 of the “babylon.gamepads.js” JavaScript file and you’ll see it will be set on the line 17 of the “babylon.gamepads.ts” TypeScript file instead:
Chrome/Opera let you reviewing the executed “babylon.gamepads.js” code but if you tries to set a breakpoint in the JavaScript version, it won’t display it. It will set it instead in the source code mapped to this version: “babylon.gamepads.ts”.
For instance, try to set a breakpoint on the line 18 of the “babylon.gamepads.js” JavaScript file and you’ll see it will be set on the line 17 of the “babylon.gamepads.ts” TypeScript file instead:
 Of course, you can also set the appropriate breakpoints directly in the TypeScript source as seen with IE11 just before.
Press F5 in the browser window hosting our demo page and you’ll be now able to debug my TypeScript code. Step up to line 20 and mouse over the “this.gamepadEventSupported” variable. It should display true:
Of course, you can also set the appropriate breakpoints directly in the TypeScript source as seen with IE11 just before.
Press F5 in the browser window hosting our demo page and you’ll be now able to debug my TypeScript code. Step up to line 20 and mouse over the “this.gamepadEventSupported” variable. It should display true:
 Set a breakpoint as usual on the line 17 and reload the page to break into the code. Firefox doesn’t support mouse hovering on the original source. Step up to line 20 and expand the “this” object instead in the right panel to check that “gamepadEventSupported” is set to true also.
 In Chrome/Opera, press the “{}” button:
 In Firefox, press also the “{}” button:
 This is much better but still not as good as it was with the source map set. To be able to go a step further, we’ve just added a new feature in the August update of IE11. You can load a source map even if you’ve removed it from the .js file.
Imagine you’d like to avoid that anyone could easily debug the production code of your web app using source map but you still want to be able to do so? Just remove the sourceMappingURL line from your .js file.
Using Internet Explorer 11, you can still use the source map by loading your local .map & associated source code. For that, right-click on the “testgamepad.min.js” tab and press “Choose source map”:
This is much better but still not as good as it was with the source map set. To be able to go a step further, we’ve just added a new feature in the August update of IE11. You can load a source map even if you’ve removed it from the .js file.
Imagine you’d like to avoid that anyone could easily debug the production code of your web app using source map but you still want to be able to do so? Just remove the sourceMappingURL line from your .js file.
Using Internet Explorer 11, you can still use the source map by loading your local .map & associated source code. For that, right-click on the “testgamepad.min.js” tab and press “Choose source map”:
 Download them here
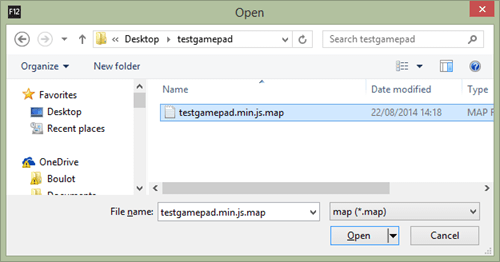
Unzip that in your preferred directory and navigate to it to choose the right .map file:
Download them here
Unzip that in your preferred directory and navigate to it to choose the right .map file:
 And now the original source code can be debugged again:
 Notice that the tab has been renamed to “testgamepad.ts” and that the first variables are now typed as we’re displaying some TypeScript.
Cool, isn’t it?
Notice that the tab has been renamed to “testgamepad.ts” and that the first variables are now typed as we’re displaying some TypeScript.
Cool, isn’t it?
Wait, what are Source Maps?
According to the great Introduction to JavaScript Source Maps article, source map is “a way to map a combined/minified file back to an unbuilt state. When you build for production, along with minifying and combining your JavaScript files, you generate a source map which holds information about your original files”. Please don’t hesitate to read Ryan Seddon’s article first as it goes in great details on how source map works. You’ll then learn that source map uses an intermediate file that does the matching between the production version of your code and its original development state. The format of this file is being described here: Source Map Revision 3 Proposal Now to illustrate, I’m going to share the way we’re currently working while developing our WebGL Babylon.js open-source framework: http://www.babylonjs.com/. It’s written in TypeScript. But the principles will remain the same if you’re using plain JavaScript compressed/minified or other languages such as CoffeeScript. Let’s now play with the source map magic directly in the browsers.The demo page we’re going to use
Recently, I’ve been implementing the support of the Gamepad API in our gaming engine. Let’s use its code for this tutorial. In this article, I’m using the following browsers:- Internet Explorer 11, August update (version 11.0.9600.17239) or even better, the developer channel version: devchannel.modern.ie supporting the Gamepad API. A sidenote on IE: Microsoft is working on a new browser Microsoft Edge so be sure to check latest web standards support for it: http://dev.modern.ie/platform/status.
- Chrome 38 developer channel (version 38.0.2125.8 dev-m)
- Opera 23
- Firefox 31 or Firefox 34 Nightly
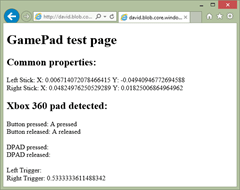
 Plug an Xbox 360 or Xbox One controller in the USB port of your machine. Press the A button to activate the gamepad and play with it:
 But don’t worry, you won’t need a gamepad controller to follow this tutorial.
Note: The TypeScript compiler is automatically generating the source map for you. If you’d like to generate a source map while generating your minified version of your code, I would recommend using Uglify JS 2: https://github.com/mishoo/UglifyJS2
For this article, I even mixed both. I’ve minified the JS generated by TypeScript and kept the source mapping intact using this command line:
uglifyjs testgamepad.js -o testgamepad.min.js --source-map testgamepad.min.js.map --in-source-map testgamepad.js.map
But don’t worry, you won’t need a gamepad controller to follow this tutorial.
Note: The TypeScript compiler is automatically generating the source map for you. If you’d like to generate a source map while generating your minified version of your code, I would recommend using Uglify JS 2: https://github.com/mishoo/UglifyJS2
For this article, I even mixed both. I’ve minified the JS generated by TypeScript and kept the source mapping intact using this command line:
uglifyjs testgamepad.js -o testgamepad.min.js --source-map testgamepad.min.js.map --in-source-map testgamepad.js.map
How to Debug with the Original Source Code
Using Internet Explorer 11
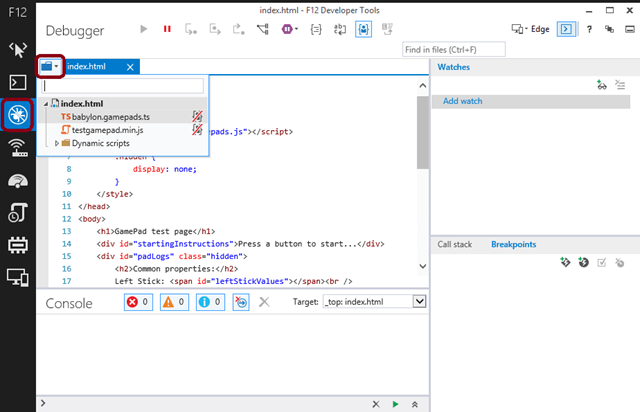
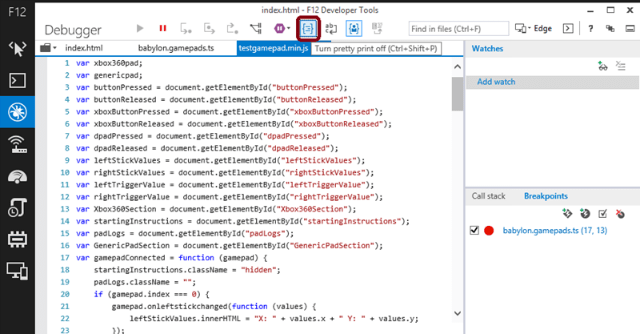
Once the gamepad test page has loaded, press F12 in IE11. You’ll see that the HTML source is referencing 2 JavaScript files: “babylon.gamepads.js” at the beginning of the page & “testgamepad.min.js” at the very end. The first file is coming from our framework on Github and the second one a simple sample showing how to consume it. Press on the “Debugger” button (or CTRL+3), then press on the folder icon. You’ll see that IE11 offers 2 files to debug: “babylon.gamepads.ts” & “testgamepad.min.js”. Let’s start by reviewing the “babylon.gamepads.ts” case. Why does IE show it instead of the .js version being executed by the browser?
This is thanks to the source map mechanism. At the end of the “babylon.gamepads.js” file, you can find this specific line:
Let’s start by reviewing the “babylon.gamepads.ts” case. Why does IE show it instead of the .js version being executed by the browser?
This is thanks to the source map mechanism. At the end of the “babylon.gamepads.js” file, you can find this specific line:
//# sourceMappingURL=babylon.gamepads.js.map
Open “babylon.gamepads.js.map” to understand how it works:
  { "version": 3,
  "file": "babylon.gamepads.js",
  "sourceRoot": "",
  "sources": [ "babylon.gamepads.ts" ],
"names": [ "BABYLON", "BABYLON.Gamepads", ... ] }
By reading this JSON file, IE11 knows it should map “babylon.gamepads.ts” to “babylon.gamepads.js”. That’s why, it directly offers you to debug the TypeScript source instead of the compiled JS version.
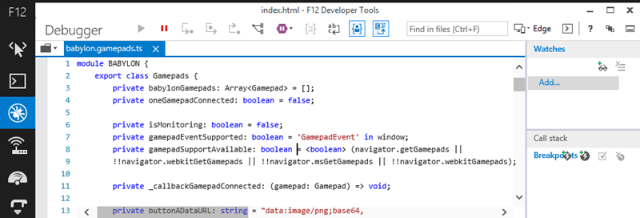
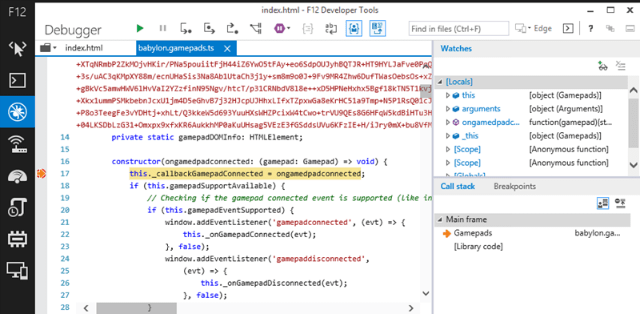
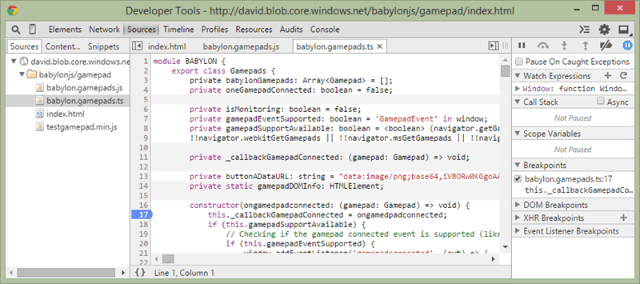
Open “babylon.gamepad.ts” in the IE11 F12 console and you’ll see something you maybe never seen before, some TypeScript language:
 You can debug it as you’re used to debug your JS code. Even if it’s the compiled JavaScript version currently being executed by the browser.
Set a breakpoint on the line 17 and press F5 in the browser window. You’ll be able to debug the TypeScript version of the constructor:
You can debug it as you’re used to debug your JS code. Even if it’s the compiled JavaScript version currently being executed by the browser.
Set a breakpoint on the line 17 and press F5 in the browser window. You’ll be able to debug the TypeScript version of the constructor:
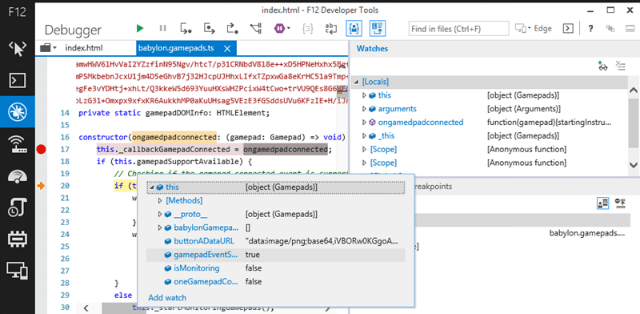
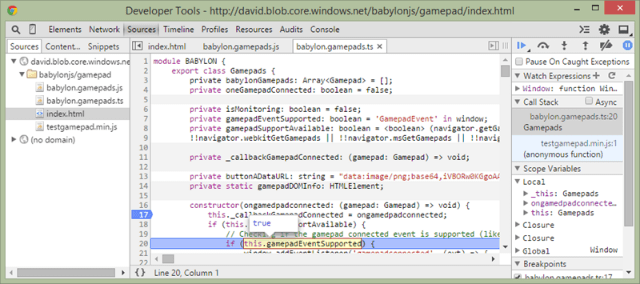
 Step up to line 20, mouse over “this” and expand it to check that “gamepadEventSupported” is set to true:

Using Chrome/Opera
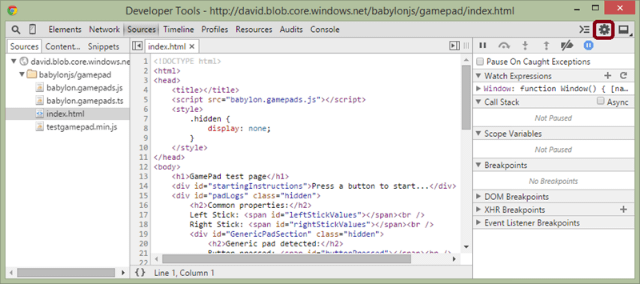
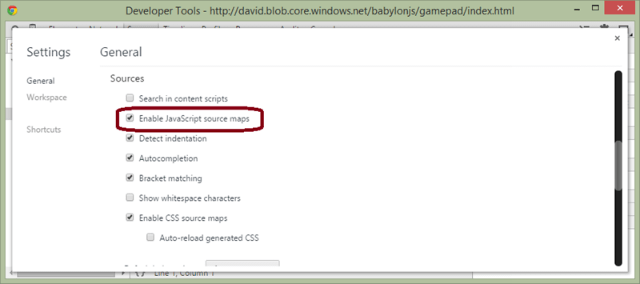
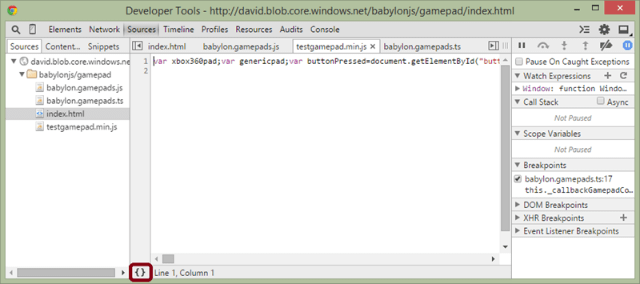
Load the same page: http://david.blob.core.windows.net/babylonjs/gamepad/index.html and press F12 in Chrome or CTRL+SHIFT+I in Opera Click on the configuration icon and make sure that the “Enable JavaScript source maps” option is enabled. It should be set by default:
 Chrome/Opera let you reviewing the executed “babylon.gamepads.js” code but if you tries to set a breakpoint in the JavaScript version, it won’t display it. It will set it instead in the source code mapped to this version: “babylon.gamepads.ts”.
For instance, try to set a breakpoint on the line 18 of the “babylon.gamepads.js” JavaScript file and you’ll see it will be set on the line 17 of the “babylon.gamepads.ts” TypeScript file instead:
Chrome/Opera let you reviewing the executed “babylon.gamepads.js” code but if you tries to set a breakpoint in the JavaScript version, it won’t display it. It will set it instead in the source code mapped to this version: “babylon.gamepads.ts”.
For instance, try to set a breakpoint on the line 18 of the “babylon.gamepads.js” JavaScript file and you’ll see it will be set on the line 17 of the “babylon.gamepads.ts” TypeScript file instead:
 Of course, you can also set the appropriate breakpoints directly in the TypeScript source as seen with IE11 just before.
Press F5 in the browser window hosting our demo page and you’ll be now able to debug my TypeScript code. Step up to line 20 and mouse over the “this.gamepadEventSupported” variable. It should display true:
Of course, you can also set the appropriate breakpoints directly in the TypeScript source as seen with IE11 just before.
Press F5 in the browser window hosting our demo page and you’ll be now able to debug my TypeScript code. Step up to line 20 and mouse over the “this.gamepadEventSupported” variable. It should display true:

Using Firefox
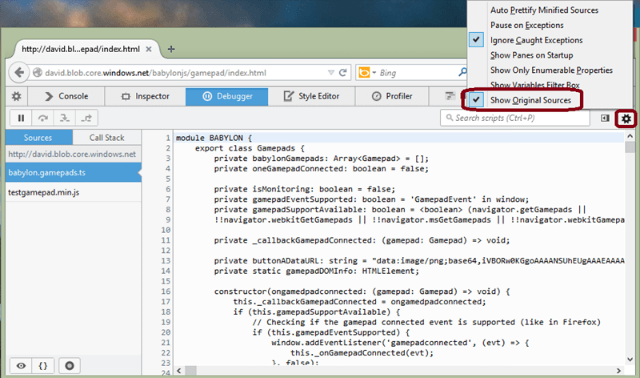
Load the same page: http://david.blob.core.windows.net/babylonjs/gamepad/index.html and press CTRL+SHIFT+S to open the native debugger (don’t use F12/Firebug, it doesn’t support source map). Check that the “Show Original Sources” option is checked: Set a breakpoint as usual on the line 17 and reload the page to break into the code. Firefox doesn’t support mouse hovering on the original source. Step up to line 20 and expand the “this” object instead in the right panel to check that “gamepadEventSupported” is set to true also.
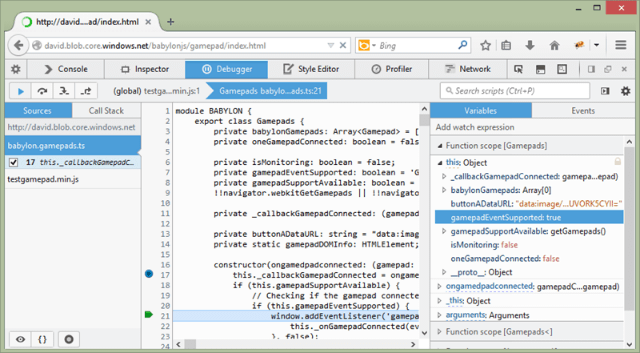

What about the minified JavaScript file?
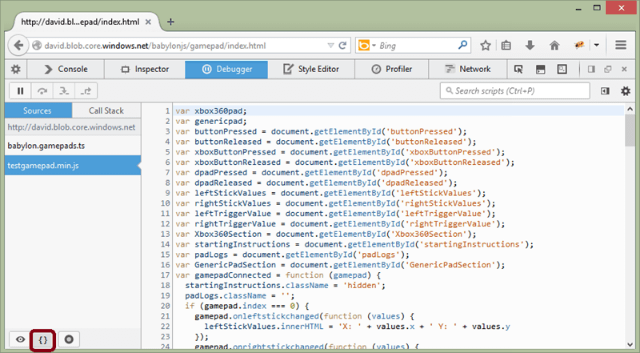
Up to now, we’ve been debugging only the “babylon.gamepads.js” code using the “babylon.gamepads.ts” source. But what about this minified “testgamepad.min.js” JavaScript file? The first solution is to prettify the code. It works with IE11/Chrome/Opera & Firefox. In IE11, press the “Pretty print” button or press CTRL+SHIFT+P: In Chrome/Opera, press the “{}” button:
 In Firefox, press also the “{}” button:
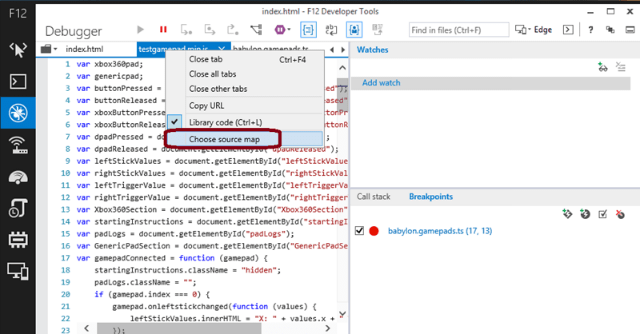
 This is much better but still not as good as it was with the source map set. To be able to go a step further, we’ve just added a new feature in the August update of IE11. You can load a source map even if you’ve removed it from the .js file.
Imagine you’d like to avoid that anyone could easily debug the production code of your web app using source map but you still want to be able to do so? Just remove the sourceMappingURL line from your .js file.
Using Internet Explorer 11, you can still use the source map by loading your local .map & associated source code. For that, right-click on the “testgamepad.min.js” tab and press “Choose source map”:
This is much better but still not as good as it was with the source map set. To be able to go a step further, we’ve just added a new feature in the August update of IE11. You can load a source map even if you’ve removed it from the .js file.
Imagine you’d like to avoid that anyone could easily debug the production code of your web app using source map but you still want to be able to do so? Just remove the sourceMappingURL line from your .js file.
Using Internet Explorer 11, you can still use the source map by loading your local .map & associated source code. For that, right-click on the “testgamepad.min.js” tab and press “Choose source map”:
 Download them here
Unzip that in your preferred directory and navigate to it to choose the right .map file:
Download them here
Unzip that in your preferred directory and navigate to it to choose the right .map file:
 And now the original source code can be debugged again:
 Notice that the tab has been renamed to “testgamepad.ts” and that the first variables are now typed as we’re displaying some TypeScript.
Cool, isn’t it?
Notice that the tab has been renamed to “testgamepad.ts” and that the first variables are now typed as we’re displaying some TypeScript.
Cool, isn’t it?
This article is part of the web dev tech series from Microsoft. We’re excited to share Microsoft Edge and the new EdgeHTML rendering engine with you. Get free virtual machines or test remotely on your Mac, iOS, Android, or Windows device @ http://dev.modern.ie/(dpe)