Plug-in Free #2: Building Interactive Bar Graphs with HTML5
Good morning, developers! I am back for part 2 in our series on plug-in free web development. While the first article was all about theory, we can now get rolling. In the following article, we'll be developing plug-in free by creating bar graphs and similar graphics, using NASDAQ's current web site as an example. But we won't be creating merely a picture of a bar graph, but a real, interactive bar graph. We will go from Flash to HTML5.

If you have Flash installed, you'll see a fancy line chart over at NASDAQ. You can float your mouse over the line and see a small popup showing the stock price at that point, along with the volume of trading, like so:
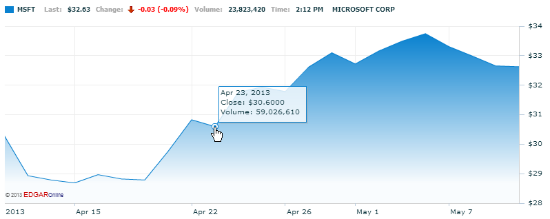
If you don't have Flash installed, then the site just shows you a graphic image. So you're not left out completely without Flash, but with HTML5, we could include everybody.
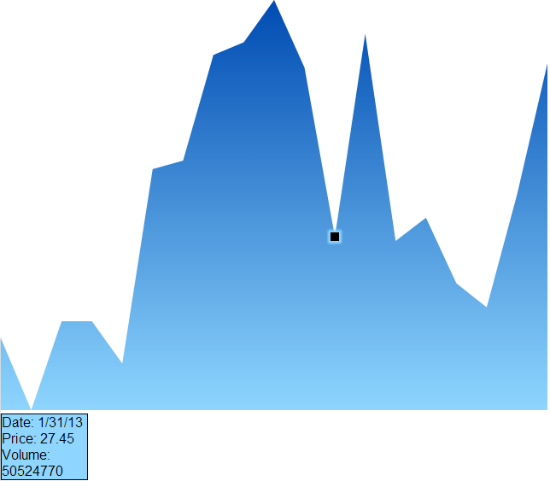
Now, we'll build something similar. To keep this article from getting too long, let's just show the data in a box below the graph. But as you move the mouse along the graph, or touch it on a tablet, it will highlight the closest point on the graph, and show the information for that point in a box. Here's what the final product will look like:
The General Layout
In general, when you develop web sites, you often want to break up your code files. For these demonstrations, however, let's not waste time fussing with projects and code files. So I'm going to put it all in a single HTML file. That way, later on you can easily break things into separateJavaScript and CSS files. If you're going to follow along hands-on, then, pick your favorite text editor and create a blank text file. Add the following lines:
- <!DOCTYPE html>
- <html>
- <head>
- </head>
- <body>
- </body>
- </html
The first line is important and required; the doctype tells the browser which version of HTML to use. Starting with HTML5, the doctype is simply html without any other parameters. The remaining lines should be familiar to you and any other web developers. Go ahead and save this file as stocks.html. Because there's no server-side code, you don't have to worry about saving it in a directory that a web server can access. Instead, we'll just load the files directly into the browser.
Gathering the Data
At the heart of any good software program is the data. We want to use stock prices, so let's gather some historical prices on Microsoft (MSFT). We could use an API to gather recent historical prices, but instead I just hand-gathered some stock prices on Microsoft.
Just before the closing </body> tag, insert an open <script> and closing </script> tag along with the following code as shown inside the script tags. (Or just copy and paste it from this article.)
- <!DOCTYPE html>
- <html>
- <head>
- </head>
- <body>
- <script>
- var prices = [
- { date:'1/15/13', price:'27.21', volume: '48224440' },
- { date:'1/16/13', price:'27.04', volume: '41062810' },
- { date:'1/17/13', price:'27.25', volume: '51647220' },
- { date:'1/18/13', price:'27.25', volume: '52165050' },
- { date:'1/22/13', price:'27.15', volume: '58642390' },
- { date:'1/23/13', price:'27.61', volume: '50288930' },
- { date:'1/24/13', price:'27.63', volume: '101321400' },
- { date:'1/25/13', price:'27.88', volume: '81814260' },
- { date:'1/28/13', price:'27.91', volume: '56054570' },
- { date:'1/29/13', price:'28.01', volume: '49234080' },
- { date:'1/30/13', price:'27.85', volume: '43571210' },
- { date:'1/31/13', price:'27.45', volume: '50524770' },
- { date:'2/1/13', price:'27.93', volume: '55548860' },
- { date:'2/4/13', price:'27.44', volume: '50508670' },
- { date:'2/5/13', price:'27.495', volume: '35367310' },
- { date:'2/6/13', price:'27.34', volume: '41750840' },
- { date:'2/7/13', price:'27.283', volume: '38007050' },
- { date:'2/8/13', price:'27.55', volume: '33318310' },
- { date:'2/11/13', price:'27.86', volume: '32163676' }
- ];
- </script>
- </body>
- </html>
This code is an array of JavaScript objects, where each object holds information about a day's stock price and volume. If you're coming from a Flash world, this code might look a lot like using ActionScript. That's because both JavaScript and ActionScript are based on the same standard, the language known as EcmaScript.
Now let's move onto the user interface.

Your Canvas
If we were using Flash, we would drop an element on the web page that can hold a Flash window. But we're not; instead we'll use the Canvas element that's part of HTML5 and available in all the modern browsers. A canvas is an area of the browser page that we can draw graphics on, and we simply specify a location on the screen and a size. Insert the following code in just after the opening <body> tag, and before the <script> tag you typed earlier; I'm showing the <body> tag so you can see where to put it:
- <body>
- <div style="margin-top:100px; margin-left:100px;">
- <canvas id="canvas1" width="1000px" height="600px"></canvas>
- <div id="pointer" width:"10px" height:"10px"></div>
- <div id="tipbox"><div id="datediv"></div><div id="pricediv"></div>
- <div id="volumediv"></div></div>
- </div>
In order to draw onto the Canvas, we need to ask the browser for the Canvas element itself. We'll use the getElementById function. Then once we have the Canvas in our JavaScript, we have to ask the canvas for something called a context, which is an object we use for drawing onto. Add the following code just before the closing </script> tag:
- var canvas = document.getElementById('canvas1');
- var context = canvas.getContext('2d');
- </script>
The first line gets the canvas by asking the document for the element whose ID is canvas1. (Notice the id attribute in the original canvas tag we added.) The second line asks the resulting canvas for the drawing context. The parameter, 2D, means we're doing 2-dimensional drawings.
Using this canvas, we will draw a line from point to point, where each point is an x-y coordinate, with the x being the date and the y being the stock price. Of course, in reality we're dealing with a 600-wide by 400-tall canvas made up of pixels, not dates and stock prices. So we need to figure out how to map the data to actual pixel locations.
What we don't want to do is hardcode actual pixel values, such as each date is ten pixels to the right of the previous date. Instead, we'll divide up that graph portion proportionally. The benefit there is that if we resize the graph, the data will stretch with it!
To do that, let's calculate some values, specifically the size of each horizontal unit; the minimum and maximum price; and using the min and max, the size of each vertical unit. Add this code before the closing script tag:
- var xsize = canvas.clientWidth;
- var ysize = canvas.clientHeight;
- var unitwidth = xsize / (prices.length - 1);
- var minprice = 99999999;
- var maxprice = 0;
- for (var i=0; i<prices.length; i++) {
- if (prices[i].price < minprice) { minprice = prices[i].price; }
- if (prices[i].price > maxprice) { maxprice = prices[i].price; }
- }
- var unitheight = ysize / (maxprice - minprice);
- </script>
The first two lines just grab the dimensions of the canvas. We're doing it this way so that we can change the canvas size later and the whole thing will continue to function, stretching the final graph into the new size. The horizontal unit size, unitwidth, is given by the horizontal size divided by one less than the number of elements. (Think about that one; 19 data points have 18 spaces between them. Thus we subtract one.) Then we do a quick loop to figure out the min and max price, and finally divide the vertical size by the difference between the max and min. (In that case we don't subtract anything from the difference, since difference gives us the same result of the space between.)
Next we're going to use a clever trick to effectively change the coordinates of the canvas. I don't want to have to take the two coordinates of each point and calculate the number of pixels. I just want to use the coordinates' actual values. So to do that I introduce a transformation, whereby I change the coordinate system for the canvas. This uses a trick called a transformation matrix, which comes from the mathematics of linear algebra. If you're unclear about it, here's a page I found with a very good explanation.
Add this line before the closing </script> tag:
- context.transform(unitwidth, 0, 0, -unitheight, 0, ysize);
- </script>
And now we can actually draw the graph. The way this works is the canvas maintains a "current position" where it can draw lines. We move to a starting position, and then draw a line to the next position, and continue to do that. We'll then return to our original position so we have a closed figure we can fill with a color. Here's the code to draw the lines; note that the lines themselves don't have a color, so we won't see anything until we fill the figure:
- context.beginPath();
- context.moveTo(0,0);
- for (var i=0; i<prices.length; i++) {
- context.lineTo(i, (prices[i].price - minprice));
- }
- context.lineTo(xsize, 0);
- context.closePath();
- </script>
Now let's fill it in so we can see it. To do this we'll create a nice color gradient. Color gradients get a line that denotes what direction the colors should flow, and then we provide the actual colors, and finally fill the figure:
- var gradient = context.createLinearGradient(0,0, 0, maxprice - minprice);
- gradient.addColorStop(0, '#8ED6FF');
- gradient.addColorStop(1, '#004CB3');
- context.fillStyle = gradient;
- context.fill();
- </script>
We now have our graph. Try it out. Here's what you'll see:

Making it Interactive
To make the graph interactive, we can track mouse positions. We'll grab only the x coordinate, and then find the nearest point on the graph, and position a small black box on that point. And we'll also locate the data point in our original array, and grab that information and push it into an HTML element. Here's the code to do all this:
- var tipbox = document.getElementById('tipbox');
- var pointer = document.getElementById('pointer');
- var datediv = document.getElementById('datediv');
- var pricediv = document.getElementById('pricediv');
- var volumediv = document.getElementById('volumediv');
- var canvasx = canvas.offsetLeft;
- var canvasy = canvas.offsetTop;
- function mousemove(e) {
- var xpos = Math.round((e.clientX - canvasx) / unitwidth);
- var priceitem = prices[xpos];
- pointer.style.left = (canvasx - 5 + xpos * unitwidth) + 'px';
- pointer.style.top = (canvasy - 5 + ysize -
- (priceitem.price - minprice) * unitheight) + 'px';
- pointer.style.display = 'block';
- tipbox.style.display = 'block';
- datediv.innerHTML = 'Date: ' + priceitem.date;
- pricediv.innerHTML = 'Price: ' + priceitem.price;
- volumediv.innerHTML = 'Volume: ' + priceitem.volume;
- }
- canvas.addEventListener("mousemove", mousemove, false);
- </script>
The first several lines just grab the different elements, as well as the absolute position of the canvas. Then we have a function that we'll call in response to the mouse moving over the canvas. (It will also respond to touches of the finger on tablet and mobile devices, so we're good there too.) The event handler grabs the horizontal position, and calculates the closest unit. Then we position the pointer block, which is just a small HTML element. And finally we make the block visible in case it wasn't already visible. Then, with the box displaying the information, we simply grab the data out of our array and push it into the various DIV elements inside the tip box, again making the tip box visible as well, in case it wasn't already.
That's it. With a little CSS styling we can make this thing beautiful. In between the <head> and </head> tags, add the following styling:
- <style>
- body {
- padding:0; margin:0; font-family: arial;
- }
- #tipbox {
- width:100px; height:auto;
- border:1px solid black;
- background-color:#8ED6FF;
- display:none;
- }
- #pointer {
- position: absolute;
- background-color:black;
- width:10px; height:10px;
- display:none;
- border:none;
- box-shadow: 0px 0px 3px 3px #8ED6FF;
- }
- </style>
This CSS is just run-of-the-mill CSS, except I do include a nice little box shadow under the pointer.
Here's the final thing. If you're reading this page in a modern HTML5-capable browser, you can try it out right here:
Conclusion
With only a very small amount of code, and a couple HTML elements and styling, we were able to create an interactive chart without a single plug-in. How about that.
We've just scratched the surface here, but you can see how we could expand on this, adding additional features quite easily. And we made it re-usable, so if you want to change the size of the canvas element with a different height and width, you can do so easily. The whole graph will still plot, stretched out to the new size.
In part three of our series we'll keep on building. Stay tuned...

About the Author(dpe)Jeff Cogswell has nearly 25 years of experience as both a software engineer and a professional writer. He has worked on development teams, doing everything from low-level C programming on Unix up to high-level web development. In the past decade he has focused his work primarily on web development, including mastering such technologies as server-side programming with C#, and client-side programming such as HTML, XML, JavaScript, and Adobe tools, and now HTML5. He has authored numerous books, including C++ All-in-One for Dummies. He writes regular columns for SourceForge and SlashDot, including columns on parallel programming and development.
This is a great tutorial Jeff! I think it’s essential to get rid of “weighty” plugins and move towards being minimal and compact. It’s amazing what a little javascript, canvas and CSS will do!
Great tutorial !
That was a great and useful tutrorial! HTML5 is sure useful, makes a site really fast on loading!