Interactive Flash Graphs and Charts For Your Website
By Usama Alam
Charts and graphs provide the visual representation of your data and help you facilitate the understanding of whatever it is you are trying to deliver. Whether you are publishing a survey report, an election result or a financial analysis, charts play a major role in data presentation.
Due to their interactivity, Flash-charts are particularly popular among designers and developers. These charts give users a way to interact with the chart, move charts among data values and see the data instead of reading, analyzing and visualizing it. In fact, many free and commercial chart plugins are available to download — you can implement them on your website right away.

Free Charts
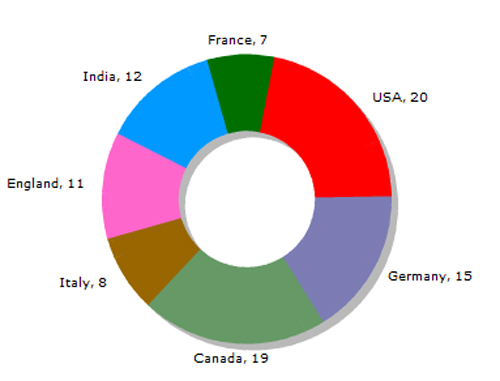
Astra Charts
Astra Charts is an open-source product of Yahoo! that enables you to present your tabular data in various graphical formats. Astra Charts empowers you to deliver animated flash charts on your websites and helps you customize and manipulate charts as per your needs. Astra Charts supports:
- Bar Charts
- Column Charts
- Line Charts
- Pie Charts
For developers, Yahoo! Developer Center offers complete ActionScript 3 class reference that gives you documentation of methods and properties used in Astra Charts.
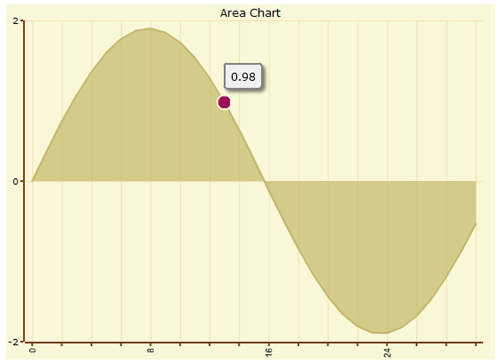
Appfire FlashCharts Plugin
Aspire FlashCharts Plugin enables you to generate interactive and animated flash charts and dashboards on your web interface. Charts are controlled by macro parameters and xml data structures. Basic chart types include:
- Area
- Bar
- Column
- Pie & Donut
- Funnel
Key features of Aspire FlashCharts Plugin include:
- Animated and interactive
- Custom labels and balloons
- Manage charts using macros
- Complete documentation, forum messages and blog entries
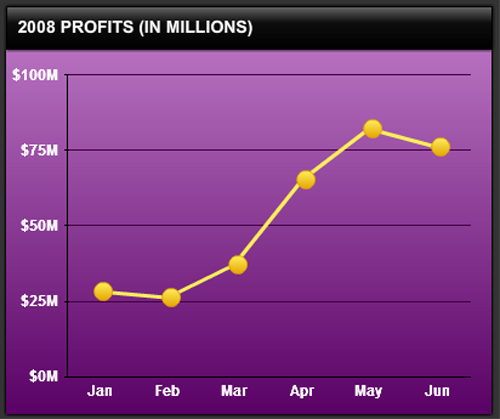
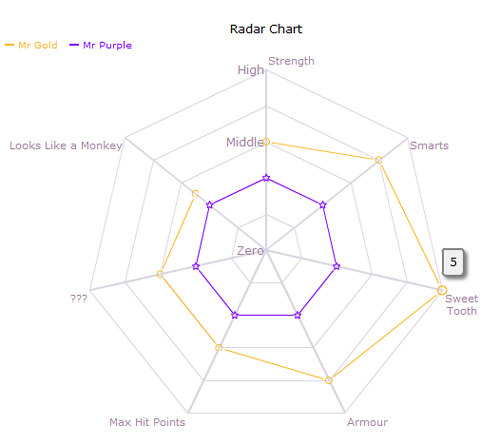
Google Chart Tools
The Google Chart Tools enable adding live charts to any web page. This library offers a rich gallery of visualizations provided as image charts (using a simple URL request to a Google chart server) or Interactive charts (using a Google developed JavaScript library). It can read live data from a variety of data sources. You can use bar charts, box charts, candlestick charts, compound charts, formulas, line charts, map charts, pie charts, QR codes, radar charts, scatter charts and Venn charts.
![]()
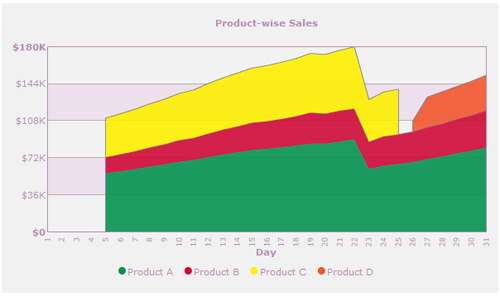
Open Flash Chart
Open Flash Chart is an open-source charting control that you can use to generate flash charts on your website. The project is primarily developed with PHP but server side libraries are available to download for Ruby, .NET, Perl, Java, Python, Coldfusion, Google Web Toolkit, Smalltalk, Pentaho and C. Chart types supported by Open Flash Chart are:
- Line
- Bar
- Horizontal Bar
- Stacked Bar
- Candle
- Area
- Pie
- Scatter
- Radar
These charts can be further categorized as per your needs.
Key features of Open Flash Charts are:
- Animated and interactive
- Data exploration
- Chart resizing
- Tooltips
- Save as image
- Highlight points
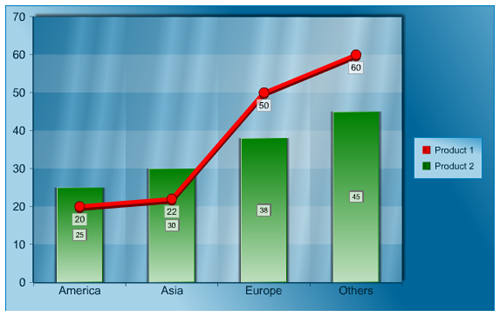
FusionCharts Free
FusionCharts Free is an open-source charting component that enables you to integrate interactive and animated flash charts in your desktop and web applications. FusionChart Free supports all necessary chart types including:
- 3D/2D Column & Bar Charts
- Line Charts
- 2D/3D Pie & Doughnut Charts
- Stacked Bar
- Area Charts
- Stacked Charts
- Combination Charts
- Candlestick Charts
- Funnel Chart
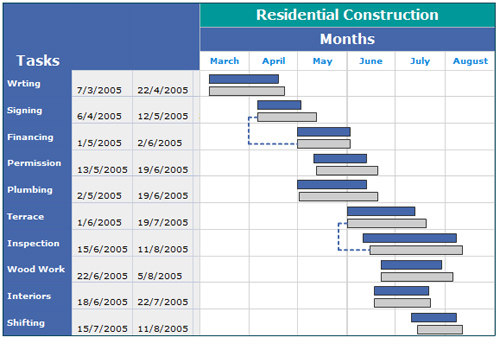
- Gantt Chart
FusionCharts Free is cross platform and can be implemented with any server side technology like ASP, PHP, JSP, .NET, Python and even with simple HTML. With FusionCharts Free, you can also deliver interactive charts in PowerPoint presentations.
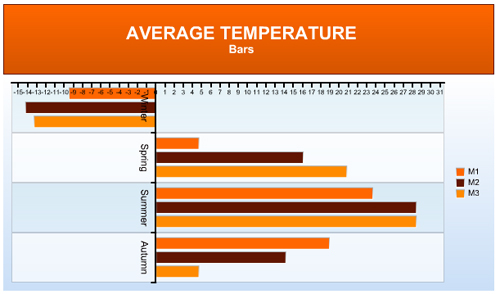
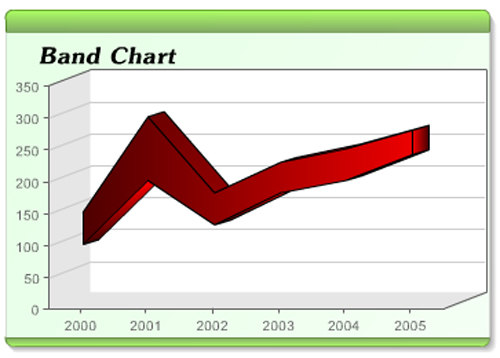
XML/SWF Charts
XML/SWF Charts offers a free tool to generate powerful flash charts to present your data graphically. It supports almost all necessary chart types such as:
- Line Charts
- Column Charts
- Pie and Donut Charts
- Stacked Charts
- Area Charts
- Candlestick Charts
- Scattered Charts
- Polar Charts
- Bubble Charts
- Mixed Charts
Key features of XML/SWF Charts include:
- Generate charts with XML file
- Use with any scripting language
- Interactive scrolling and drill-down
- Rich user experience with transparency, shadow, bevel, glow, blue and animated transitions
- Full-screen mode
- Save charts as bitmap
- Unicode support to show special characters
Rich Chart Live
Rich Chart Live enables you to deliver flash charts on your website with minimal efforts. You don't need to download or install anything, it just needs a flash-enabled web browser. Rich Chart Live also offers a free edition that shows a logo with each chart showing the chart is generated with free edition of Rich Chart. It supports following chart types:
- Area
- Bar
- Column
- Pie & Donut
- Line
Key features of Rich Chart Live include:
- Platform independent
- Animated charts
- Generate using templates
- Export data to flash or powerpoint
- Supports Japenese, Chinese and other Unicode languages
Commercial Charts
Swiff Chart
Swiff Chart generates eye-catching animated charts with PHP, JSP and ASP.NET. It can query the database for the records and generates charts in flash, image and PDF formats. Supported chart types are:
- Line
- Bar
- Area
- Column
- Pie & Donut
- Gantt
Features of Swiff Chart include:
- High impact graphics
- Animated and interactive charts
- Multiple chart types (Flash, SVG, PDF, Image)
- Drill-down
- Export to multiple formats including compressed file
- Ready-made templates
- Instant data import
- Visual tools for customization
- Custom Labels

Price:
Standard Edition: $149
Professional Edition: $299
Click here for complete pricing
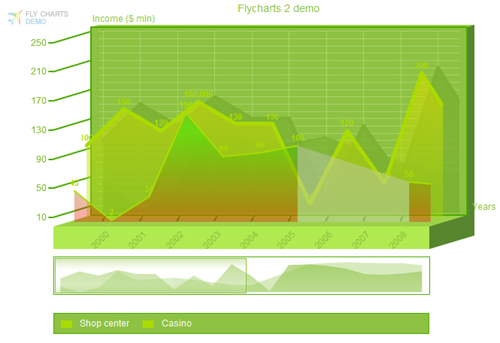
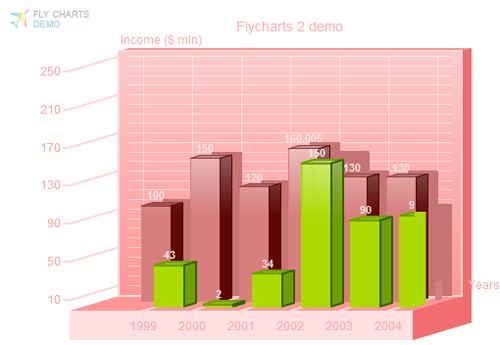
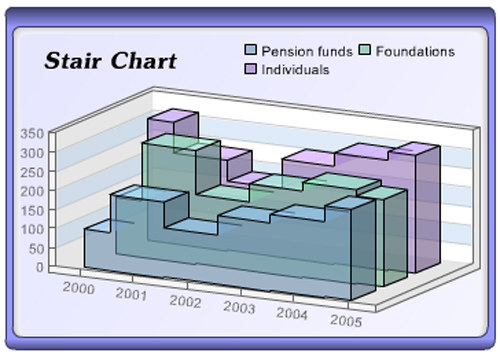
Fly Charts
Fly Charts is an XML-based charting solution that enables you to generate interactive and animated charts on the fly. It doesn't need knowledge of flash, HTML or any other scripting language. Following chart types are supported by Fly Charts:
- Line
- Area
- Column
- Bar
- Stair
- Pie
- Mixed
Fly Charts includes following features:
- Animated and interactive charts
- Generate charts on the fly
- No technical knowledge required
- Cross-platform
- Rich and customizable interface
- Chart creation using wizard
Price:
One Site: $99
Unlimited: $349
Developer Version: $799
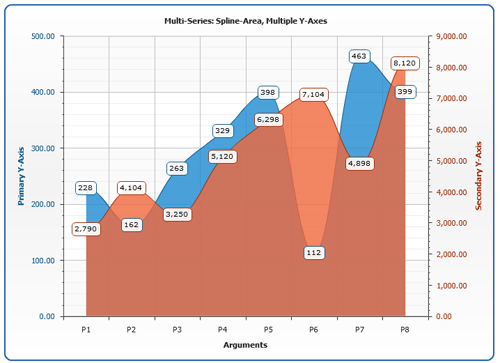
AnyChart
AnyChart offers flash based charts for your desktop and web applications. It empowers your website with interactive charts for enhanced user experience. It is very easy to implement and works with almost all programming languages. Supported chart types are:
- Column
- Bar
- Line
- Spline
- Area
- Stacked
- Dot/Marker
- Bubble
- Candlestick
- Scatter
- Pie & Donut
- Gauge
Key features of AnyChart include:
- Platform independent
- Animated charts
- Printable and exportable
- Supports multiple axes
- Supports logarithmic values
- Inverted axes
- Interactive dashboards
- Custom fields, legends and tooltips
- Multiple color techniques
- Ready-made templates
Price:
Single Developer: $499
4 Developer Team License: $999
Unlimited Developer Site License: $2,999
Click here for complete pricing
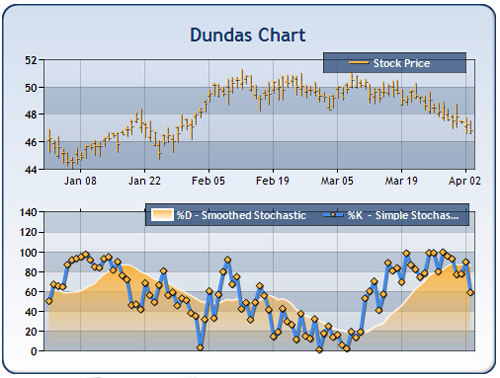
Dundas Chart for .NET
Dundas Chart for .NET offers feature-rich charts and graphs for your ASP.NET and Windows applications. It supports chart animation in Flash and SVG formats. Following chart types are supported by Dundas Charts for .NET:
- Column
- Bar
- Pie & Donut
- Line
- Area
- Bubble/Points
- Stock
- Funnel & Pyramid
- Error bar
- Gantt
- Spline
- Circular
Key features of Dundas Charts for .NET include:
- Animated flash and SVG charts
- Automatic layout management
- AJAX based server handling
- Data drill-down
- Multiple image formats
- Multiple legends
- Scrolling and zooming
- Chart templates
- View state management
- Integrate with OLAP services
- Callback events
Price:
Professional Edition: $769
Enterprise Edition: $3,299
Click here for complete pricing
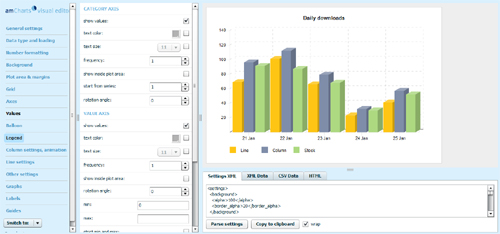
amCharts
amCharts offers flash-based dynamic charts for your website. It can generate charts with data from CSV and XML and can also manipulate data from programming languages like PHP, .NET, ColdFusion, Perl, Java, and Ruby on Rails. amCharts offers a visual editor that you can use to configure your charts visually. It supports following chart types:
- Column
- Bar
- Stock
- Line
- Area
- Pie & Donut
- Scatter
- Bubble
- Radar
- Polar
Key features of amCharts include:
- Platform independent
- Exportable
- Animated backgrounds
- Reversed axis
- Present logarithmic values
- Custom description of data points
- Drill-down
- Gradient fills
Price:
Single Website License: 85 Euro
Multiple Websites License: 275 Euro
Developer License: 450 Euro
Click here for complete pricing
Flash Charts Pro
Flash Charts Pro offers cross-browser, platform-independent animated charts for your websites. It works with almost all scripting languages and processes data presented in XML format. Flash Charts Pro supports following chart types:
- Column
- Bar
- Pie
- Line
- Candlestick
- Stacked
- Scatter
Key features of Flash Charts Pro include:
- Interactive and animated charts
- Multi-language support
- Trendline and zone support
- Dynamically resizable
- Easy implementation
- Inverted axes
- Interactive dashboards
- Custom fields, legends and tooltips
- Multiple color techniques
- Ready-made templates
Price:
User License: $59
Developer License: $99
Professional License: $199
Click here for complete pricing
Animated Chart
Animated Chart enables you to present static and dynamic flash-based animated charts on your website. The Pro edition enables you to deliver live data in your flash charts. Following chart types are supported by Animated Charts:
- Column
- Bar
- Area
- Bubble
- Pie & Donut
- Line
- Scatter
- Radar
- Stock
Animated Chart includes following features:
- Static and animated flash charts
- Fully customizable
- Visual effects like Appear, Grow, Fall, NeonAppear, Slide, Gather, Swing, Rotate
- Apply Flash 8 animation effects
- Export to HTML
- Import data Excel or text file
Price:
Standard Edition: $49
Professional Edition: $69
Big Faceless Java Graph Library
Big Faceless Java Graph Library is a class library for Java to create 2D, 3D and shaded 3D interactive graphs on your website. It gives graphical representation in PNG, Flash, SVG or PDF formats. It supports following chart types:
- Column
- Bar
- Area
- Line
- Pie & Donut
- Scatter
- Bubble
- Funnel
- Gantt
Key features of Big Faceless Java Graph Library include:
- Easy implementation
- Web service interface for graph creation
- Adjustable light source
- Generate charts in Flash, PNG, SVG and PDF formats
- Create custom tags
- Supports logarithmic axes
- Complete documentation and API reference
Price:
Click here to calculate price as per your need
Rich Chart Builder
Rich Chart Builder enables you to generate animated and interactive flash charts for a variety of purposes. It also enables you to request custom chart for your specific needs. The distinguishing feature is chart can contain audio narration. Following chart types are supported by Rich Chart Builder:
- Area
- Bar
- Column
- Pie & Donut
- Line
Key features of Rich Chart Builder include:
- Animated and interactive charts
- Platform independent
- Audio narration
- Publish to Powerpoint
- Publish charts to image or PDF
- Ready-made templates
- Data export
- Unicode support
Price:
Standard Edition: $95
Professional Edition: $199
Click here for complete pricing
WebCharts3D
WebCharts is a Java based data visualization solution for your web applications. It generates interactive and animated high quality charts in various formats including Flash. It incorporates sophisticated caching and resource management algorithms that enable the product to deliver high performance presentation. It includes following chart types:
- Line
- Bar
- Pyramid
- Step
- Stair
- Area
- Curve
- Scatter
- Prism
- Column
- Box-whisker
- Bubble
- Ring Frame
- Radar
- Pie & Donut
- Gauge
- Gantt
- Histogram & Regression
- Maps
Features of WebCharts3D include:
- Animated and interactive charts
- Multiple chart types (Flash, SVG, PDF, Image)
- Drill-down
- High performance
- Designer generated code
- Automatic and manual customization
- Multiple scales
- Custom Labels
- Optional placeable data table
- Manage mouse events
Price:
Professional Edition: $550
Enterprise Edition: $750
Click here for complete pricing
Further Resources
Following articles are suggested for further reading:
- Charts And Graphs: Modern Solutions
- 7 Flash Chart Solutions
- 10 Best Flash and Silverlight Chart Controls
- Free Animated Flash Charts and Graphs
About the author
Muhammad Usama Alam is a software engineer and web developer with over 8 years of experience in designing and developing business solutions for enterprise.
You can follow him @ twitter.
A really good list of resources, thanks! We have used the Google Charts before, but not the others – might check out one or two of them. Thanks again for a useful article.
It’s amazing that you have missed Microsoft’s free charting controls for ASP.NET developers.
http://weblogs.asp.net/scottgu/archive/2008/11/24/new-asp-net-charting-control-lt-asp-chart-runat-quot-server-quot-gt.aspx
need opensource charts used in php please send links…………………
perfect post very thanks
nice but where is fusioncharts??
FlyCharts look really stylish. I’m going to try this component and then implement it on my flashmoto website. I wonder is it compatible with flashmoto.com ?
perfect post very thanks
This is a very great resource for charting applications.
High Charts is another good one as well, it’s all JavaScript and very interactive too. Google for the link…
It’s good to see all the options available. As a dashboard designer for enterprise applications, I’d definitely advise anyone who is looking to use any of the charting visualizations for their software to read up on best practices.
It’s important to look nice and to be usable — too many of the “sexy” visualizations (pie charts, 3-d stacked graphs, gradients, etc.), while visually impressive, are difficult to interpret, or aren’t usable at all.
I’d recommend starting with “Information Dashboard Design” by Stephen Few and “Turning Numbers into Knowledge” by Dr. Jonathan Koomey.
Thanks for sharing!
Nice concise resource list, thank you.
Corda’s PopChart (commercial) also produces interactive flash as well as png, jpg, svg, pdf, and a few other formats. It’ll even detect if you have flash installed, and if not, produce png with a js image map for interactivity. PopChart tends to be more expensive, but it’s robustness, image engine speed, scalability, and visual flexibility are fantastic.
Notable OEMs that use PopChart: Salesforce.com, Omniture, Oracle, SAP.
Awesome. Will share with my marketing research students!
Thank you SOO much. I’m making some web app, and all week I’ve been trying to fi nd FREE CHARTS. Al-thought these are Flash version do you know maybe is there a big time gap in loading of charts or analyses results between charts and for examp,e Java oe ASP.NET charts and analyses? Can you p,lease tell meor recommend me someone that you might now coz app that I’m making is for market research and final goal is Data Visualization on any possible way. Charts, Stat, Analyses, doesn’t metter as good as the Fast and real-time Precise results and of course to look beautiful. So, again does it makes difference in ti e loading if it is a Flash Analyses? Thanks a lot!
Nice roundup !
Thanks !
i heard there arent any working ms points gens…
Hey this blog is really nice i think i can get a lot out of it…..
Really nice collection, thanks for it.
What about highcharts? Nice javascript instead of flash.
Superb roundup of charts APIs for your website! I knew the Dundas ones and the Google Charts APIs but the others I hadnt known before! Thanks for this!
hi…
cool collection..
i found one more very interesting charts gallery called fusion charts
http://www.fusioncharts.com
Glad to find these, thanks for sharing friend
hi,
Thanks, it is really a great article for charts.
Thanks you once again.
Munnabhai-Dhanashree Inc
I Really enjoy the way in which you write…thanks for publishing
wow !flash is power!
thank you nice sharing, my friend
Great list of flash charts. Some of them are really good and expensive. But considering the features probably they worth.
The quickie loan and it is possible to withdraw from the Japanese whole country by no examination by using the shopping frame of the credit card. Please use credit by all means if it is credit card realization.
Thanks for all the information compiled on this page. I looked at these products but was not sure if there is any one of them in which I could click on the zone ( pie or bar ) and then see the actual data associated with it. Can the drill down data be tabular data. If anybody can provide any feedback I would appreciate it.
Thanks soo much !!
I think im going to go with the fleshlight
These are very nice professional looking charts. I will definitely be using some of these.
I’m not competent enough in Flash to use a component, so this kind of product is ideal. All I ask is that, once I’ve paid for it (and price isn’t a problem, within reason) I can create what I want. Extensive Google searching has drawn a blank, but maybe I’m using the wrong terms.In addition, both aXmag.com and Issuu.com are good choice.
I found this
http://raphaeljs.com/
Sometimes babies like to bite those toys. I wonder, is it really safe to use for them?
I like activeden charts http://activeden.net/item/flash-charts-package-interactiveas3xml/116824 They include the source code for US$ 35.